2014 Clare County Council election
A Clare County Council election was held in Ireland on 23 May 2014 as part of that year's local elections. Twenty-eight councillors were elected for a five-year term of office from four local electoral areas by proportional representation with a single transferable vote.[1][2] This was a reduction in 4 council seats and 2 LEAs when compared to the previous elections held in 2009.
| |||||||||||||||||||||||||||||||||||||
All 28 seats to Clare County Council | |||||||||||||||||||||||||||||||||||||
|---|---|---|---|---|---|---|---|---|---|---|---|---|---|---|---|---|---|---|---|---|---|---|---|---|---|---|---|---|---|---|---|---|---|---|---|---|---|
| |||||||||||||||||||||||||||||||||||||
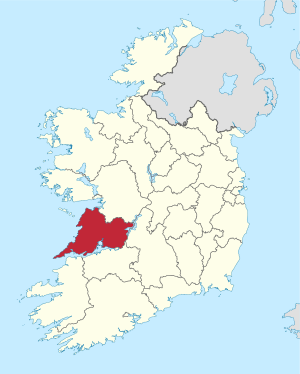 Map showing the area of Clare County Council | |||||||||||||||||||||||||||||||||||||
| |||||||||||||||||||||||||||||||||||||
Fianna Fáil re-emerged as the largest party in Clare after the elections with 12 seats. In addition Clare Colleran-Molloy, a sister of the journalist Ger Colleran, won a seat for the party in Ennis and became the party's first ever female elected councillor. Brian Meaney, formerly of the Green Party, had defected to Fianna Fáil but failed to be re-elected. Fine Gael lost 4 seats in the election including that of the Council's outgoing Mayor, Joe Arkins, in Killaloe. The Labour Party lost their sole representative while Sinn Féin won a seat on the Council for the first time since 1974. Despite some retirements Independents retained a share of 7 seats.[3]
Results by party
| Party | Seats | ± | 1st pref | FPv% | |
|---|---|---|---|---|---|
| Fianna Fáil | 12 | +1 | 18,432 | 35.73 | |
| Fine Gael | 8 | -4 | 16,239 | 31.48 | |
| Sinn Féin | 1 | +1 | 2,188 | 4.24 | |
| Independent | 7 | - | 11,100 | 21.52 | |
| Labour Party | 0 | -1 | 1,622 | 3.14 | |
| Green Party | 0 | -1 | 490 | 0.95 | |
| Totals | 28 | -4 | 51,583 | 100% | |
Results by Electoral Area
Ennis
| Ennis - 8 seats | ||||||||||||||||||||||||
|---|---|---|---|---|---|---|---|---|---|---|---|---|---|---|---|---|---|---|---|---|---|---|---|---|
| Party | Candidate | FPv% | Count 1 | Count 2 | Count 3 | Count 4 | Count 5 | Count 6 | Count 7 | Count 8 | Count 9 | Count 10 | Count 11 | Count 12 | Count 13 | Count 14 | Count 15 | Count 16 | Count 17 | Count 18 | Count 19 | Count 20 | ||
| Independent | James Breen* | 8.81 | 1,134 | 1,141 | 1,157 | 1,188 | 1,199 | 1,218 | 1,235 | 1,279 | 1,339 | 1,387 | 1,449 | |||||||||||
| Fine Gael | Johnny Flynn* | 8.55 | 1,100 | 1,104 | 1,118 | 1,138 | 1,168 | 1,184 | 1,210 | 1,227 | 1,254 | 1,322 | 1,351 | 1,481 | ||||||||||
| Fianna Fáil | Tom McNamara* | 8.15 | 1,049 | 1,053 | 1,055 | 1,061 | 1,068 | 1,075 | 1,115 | 1,119 | 1,128 | 1,150 | 1,173 | 1,221 | 1,223 | 1,223 | 1,265 | 1,299 | 1,320 | 1,360 | 1,371 | 1,379 | ||
| Fianna Fáil | Pat Daly* | 7.77 | 1,000 | 1,003 | 1,006 | 1,022 | 1,027 | 1,037 | 1,072 | 1,086 | 1,104 | 1,122 | 1,138 | 1,167 | 1,171 | 1,173 | 1,287 | 1,367 | 1,418 | 1,579 | ||||
| Independent | Ann Norton | 6.38 | 821 | 1,121 | 1,125 | 1,129 | 1,153 | 1,224 | 1,311 | 1,484 | ||||||||||||||
| Fine Gael | Paul Murphy* | 6.25 | 804 | 805 | 807 | 807 | 814 | 815 | 826 | 833 | 842 | 871 | 889 | 923 | 928 | 928 | 1,061 | 1,083 | 1,127 | 1,167 | 1,173 | 1,179 | ||
| Fine Gael | Gerard O'Halloran | 6.25 | 804 | 805 | 808 | 829 | 839 | 841 | 844 | 848 | 853 | 868 | 872 | 912 | 917 | 918 | 933 | 937 | 958 | 985 | 990 | 996 | ||
| Fine Gael | Mary Howard* | 5.59 | 720 | 724 | 729 | 738 | 761 | 771 | 806 | 832 | 848 | 894 | 936 | 1,014 | 1,033 | 1,034 | 1,072 | 1,137 | 1,238 | 1,316 | 1,343 | 1,357 | ||
| Fianna Fáil | Claire Colleran-Molloy | 4.54 | 584 | 586 | 593 | 599 | 608 | 618 | 647 | 658 | 669 | 684 | 708 | 741 | 746 | 747 | 815 | 851 | 892 | 945 | 979 | 999 | ||
| Fianna Fáil | Bernard Hanrahan | 3.89 | 501 | 502 | 505 | 514 | 516 | 524 | 532 | 534 | 542 | 554 | 569 | 579 | 579 | 579 | ||||||||
| Independent | Michael Guilfoyle | 3.62 | 466 | 468 | 473 | 486 | 493 | 499 | 507 | 518 | 531 | 551 | 579 | 594 | 596 | 603 | 630 | |||||||
| Independent | Frankie Neylon | 3.42 | 440 | 443 | 448 | 458 | 460 | 467 | 475 | 486 | 528 | 559 | 588 | 598 | 601 | 603 | 640 | 810 | 881 | |||||
| Fine Gael | Cillian Griffey | 3.30 | 425 | 426 | 433 | 440 | 457 | 465 | 479 | 492 | 501 | 529 | 549 | |||||||||||
| Fine Gael | Tony Mulqueen* | 3.08 | 396 | 404 | 404 | 414 | 420 | 424 | 446 | 458 | 472 | |||||||||||||
| Sinn Féin | Cathal O'Reilly | 3.05 | 392 | 396 | 403 | 408 | 413 | 421 | 427 | 442 | ||||||||||||||
| Labour Party | Dermot Hayes | 2.59 | 333 | 343 | 364 | 376 | 421 | 472 | 481 | 514 | 533 | 564 | 603 | 622 | 624 | 625 | 642 | 671 | ||||||
| Independent | Paula McNamara | 2.56 | 330 | 343 | 356 | 365 | 383 | 407 | 414 | 452 | 497 | 512 | ||||||||||||
| Fianna Fáil | Brian Meaney* | 2.35 | 302 | 304 | 305 | 306 | 317 | 320 | ||||||||||||||||
| Independent | Paul O'Shea | 2.00 | 257 | 265 | 276 | 286 | 301 | 326 | 330 | |||||||||||||||
| Independent | Felix Omorodion | 1.83 | 236 | 239 | 292 | 292 | 298 | |||||||||||||||||
| Labour Party | Seamus Ryan | 1.78 | 229 | 252 | 260 | 263 | ||||||||||||||||||
| Independent | Joe Corbett | 1.62 | 208 | 211 | 217 | |||||||||||||||||||
| Independent | George Atijohn | 1.53 | 197 | 209 | ||||||||||||||||||||
| Green Party | Gerben Uunk | 0.71 | 92 | |||||||||||||||||||||
| Fís Nua | Vera Moloney | 0.23 | 30 | |||||||||||||||||||||
| Independent | Tommy Kelly | 0.09 | 12 | |||||||||||||||||||||
| Fís Nua | Damon Wise | 0.05 | 7 | |||||||||||||||||||||
| Electorate: 23,797 Valid: 12,869 (54.08%) Spoilt: 139 Quota: 1,430 Turnout: 13,008 (54.66%) | ||||||||||||||||||||||||
Killaloe
| Killaloe - 6 seats | |||||||||||
|---|---|---|---|---|---|---|---|---|---|---|---|
| Party | Candidate | FPv% | Count 1 | Count 2 | Count 3 | Count 4 | Count 5 | Count 6 | Count 7 | ||
| Fine Gael | Joe Cooney* | 25.63 | 2,843 | ||||||||
| Fianna Fáil | Pat Hayes* | 13.43 | 1,490 | 1,767 | |||||||
| Independent | Michael Begley* | 12.53 | 1,390 | 1,468 | 1,475 | 1,529 | 1,799 | ||||
| Fianna Fáil | Tony O'Brien | 11.67 | 1,294 | 1,391 | 1,408 | 1,427 | 1,465 | 1,484 | 1,767 | ||
| Fine Gael | Pat Burke* | 7.44 | 825 | 1,119 | 1,148 | 1,184 | 1,255 | 1,270 | 1,406 | ||
| Fianna Fáil | Alan O'Callaghan | 7.13 | 791 | 916 | 936 | 991 | 1,100 | 1,119 | 1,323 | ||
| Fine Gael | Joe Arkins* | 6.81 | 755 | 851 | 870 | 925 | 992 | 1,019 | 1,116 | ||
| Fís Nua | Niamh O'Brien | 6.59 | 731 | 817 | 840 | 903 | |||||
| Fianna Fáil | Liam Wiley | 5.87 | 651 | 828 | 886 | 909 | 968 | ||||
| Labour Party | Donal Higgins | 2.91 | 323 | 351 | 360 | ||||||
| Electorate: 17,593 Valid: 11,093 (63.05%) Spoilt: 88 Quota: 1,585 Turnout: 11,181 (63.55%) | |||||||||||
Shannon
| Shannon - 6 seats | ||||||||||||||
|---|---|---|---|---|---|---|---|---|---|---|---|---|---|---|
| Party | Candidate | FPv% | Count 1 | Count 2 | Count 3 | Count 4 | Count 5 | Count 6 | Count 7 | Count 8 | Count 9 | Count 10 | ||
| Fianna Fáil | Cathal Crowe* | 18.26 | 1,929 | |||||||||||
| Fine Gael | John Crowe* | 11.54 | 1,219 | 1,261 | 1,267 | 1,276 | 1,280 | 1,294 | 1,304 | 1,401 | 1,443 | 1,615 | ||
| Independent | Gerry Flynn* | 9.84 | 1,040 | 1,045 | 1,103 | 1,140 | 1,225 | 1,290 | 1,343 | 1,375 | 1,471 | 1,510 | ||
| Fianna Fáil | Pat McMahon* | 9.69 | 1,024 | 1,053 | 1,055 | 1,067 | 1,072 | 1,130 | 1,134 | 1,161 | 1,188 | 1,356 | ||
| Independent | P.J. Ryan* | 7.44 | 825 | 866 | 894 | 899 | 910 | 949 | 973 | 999 | 1,072 | 1,389 | ||
| Sinn Féin | Mike McKee | 7.32 | 773 | 793 | 801 | 816 | 856 | 889 | 917 | 951 | 1,153 | 1,192 | ||
| Fine Gael | Sean McLoughlin* | 7.30 | 771 | 778 | 793 | 847 | 890 | 939 | 955 | 997 | 1,016 | 1,060 | ||
| Fianna Fáil | Pat O'Gorman | 7.09 | 749 | 813 | 816 | 819 | 822 | 885 | 889 | 933 | 960 | |||
| Labour Party | Pascal Fitzgerald* | 5.87 | 506 | 644 | 645 | 685 | 691 | 692 | 702 | |||||
| Anti-Austerity Alliance | David Houlihan | 3.78 | 399 | 444 | 455 | 460 | 469 | 476 | 704 | 863 | ||||
| Fianna Fáil | Louise Roche McNamara | 3.26 | 344 | 361 | 366 | 373 | 392 | |||||||
| Anti-Austerity Alliance | Seónaidh Ní Shíomóin | 3.10 | 327 | 342 | 358 | 375 | 398 | 423 | ||||||
| Independent | Cathy McCafferty | 2.30 | 243 | 247 | 259 | 279 | ||||||||
| Labour Party | Tony McMahon | 2.19 | 231 | 234 | 239 | |||||||||
| Independent | Mike Fleming | 1.40 | 148 | 155 | ||||||||||
| Fís Nua | Karen Wise | 0.17 | 18 | 19 | ||||||||||
| Electorate: 20,294 Valid: 10,565 (52.06%) Spoilt: 89 Quota: 1,510 Turnout: 10,654 (52.50%) | ||||||||||||||
West Clare
| West Clare - 8 seats | |||||||||||||||
|---|---|---|---|---|---|---|---|---|---|---|---|---|---|---|---|
| Party | Candidate | FPv% | Count 1 | Count 2 | Count 3 | Count 4 | Count 5 | Count 6 | Count 7 | Count 8 | Count 9 | Count 10 | Count 11 | ||
| Independent | Christy Curtin* | 11.36 | 1,938 | ||||||||||||
| Fianna Fáil | Richard Nagle* | 10.76 | 1,835 | 1,836 | 1,857 | 1,860 | 1,864 | 2,049 | |||||||
| Fine Gael | Bill Slattery* | 10.37 | 1,769 | 1,772 | 1,788 | 1,792 | 1,834 | 2,046 | |||||||
| Fianna Fáil | Michael Hillery* | 8.26 | 1,408 | 1,413 | 1,427 | 1,440 | 1,449 | 1,551 | 1,590 | 1,603 | 1,722 | 1,864 | 1,883 | ||
| Fianna Fáil | P.J. Kelly* | 8.11 | 1,383 | 1,390 | 1,395 | 1,398 | 1,416 | 1,442 | 1,461 | 1,463 | 1,560 | 1,607 | 1,621 | ||
| Fine Gael | Oliver Garry* | 7.18 | 1,224 | 1,229 | 1,236 | 1,239 | 1,309 | 1,392 | 1,400 | 1,452 | 1,464 | 1,507 | 1,524 | ||
| Independent | Ian Lynch | 7.14 | 1,218 | 1,270 | 1,349 | 1,353 | 1,579 | 1,608 | 1,609 | 1,612 | 1,737 | 2,037 | |||
| Fianna Fáil | Bill Chambers* | 6.53 | 1,113 | 1,124 | 1,132 | 1,136 | 1,212 | 1,244 | 1,252 | 1,254 | 1,510 | 1,594 | 1,619 | ||
| Sinn Féin | Noeleen Moran | 6.00 | 1,023 | 1,036 | 1,117 | 1,119 | 1,156 | 1,253 | 1,273 | 1,298 | 1,350 | ||||
| Fine Gael | Gerard Kennedy | 5.92 | 1,010 | 1,014 | 1,041 | 1,042 | 1,057 | ||||||||
| Fianna Fáil | Patrick Keane* | 5.78 | 985 | 989 | 1,024 | 1,025 | 1,063 | 1,120 | 1,136 | 1,141 | |||||
| Fine Gael | Gabriel Keating* | 5.58 | 952 | 957 | 988 | 991 | 1,078 | 1,144 | 1,155 | 1,203 | 1,505 | 1,569 | 1,590 | ||
| Fine Gael | Marian McMahon-Jones | 3.65 | 622 | 644 | 662 | 663 | |||||||||
| Green Party | Kevin Heapes | 2.33 | 398 | 415 | |||||||||||
| Independent | Joseph Enright | 0.53 | 90 | ||||||||||||
| Independent | Jackie Dale | 0.52 | 88 | ||||||||||||
| Electorate: 28,936 Valid: 17,056 (58.94%) Spoilt: 215 Quota: 1,896 Turnout: 17,271 (59.69%) | |||||||||||||||
References
- Proportional Representation Citizens Information, 2009-09-21.
- Local Election Results for Clare County Council Irish Times. Retrieved: 2014-05-31.
- Archived 2015-09-23 at the Wayback Machine Clare County Council 2014 Election results. Retrieved: 2015-03-14.