2014 Carlow County Council election
An election to Carlow County Council took place on 23 May 2014 as part of that year's Irish local elections. 18 councillors were elected from two electoral divisions by PR-STV voting for a five-year term of office. Ahead of the 2014 election Carlow was redrawn into two electoral areas, a reduction in three from five, and the number of councillors was reduced to 18, from a previous total of 21. Carlow Town Council and Muinebheag Town Council were both abolished.
| |||||||||||||||||||||||||||||||||
All 18 seats to Carlow County Council | |||||||||||||||||||||||||||||||||
|---|---|---|---|---|---|---|---|---|---|---|---|---|---|---|---|---|---|---|---|---|---|---|---|---|---|---|---|---|---|---|---|---|---|
| |||||||||||||||||||||||||||||||||
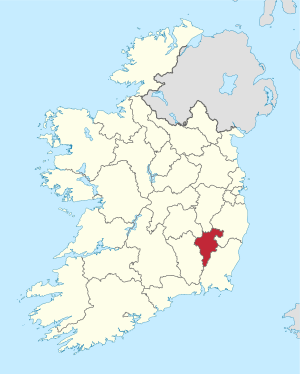 Map showing the area of Carlow County Council | |||||||||||||||||||||||||||||||||
| |||||||||||||||||||||||||||||||||
While Fine Gael remained the largest party after the election, in terms of seats though not in terms of vote share, they lost two fifths of their councillors. Their colleagues in Government, the Labour Party, lost three fifths of their councillors being reduced to just 2 seats. Fianna Fáil gained a seat to return 5 members and reported a higher vote than Fine Gael but the big winners were Sinn Féin who won 3 seats to supplant Labour as the traditional third largest party.
Results by party
| Party | Seats | ± | First Pref. votes | FPv% | ±% | |
|---|---|---|---|---|---|---|
| Fine Gael | 6 | -4 | 5,808 | 27.0% | ||
| Fianna Fáil | 5 | +1 | 6,207 | 28.9% | ||
| Sinn Féin | 3 | +3 | 2,723 | 12.7% | ||
| Labour Party | 2 | -3 | 2,830 | 13.2% | ||
| Independent | 2 | - | 3,010 | 14% | ||
| Totals | 18 | -3 | 100% | — | ||
Results by Electoral Area
- "Local Election: Carlow County Council". RTÉ. Archived from the original on 2014-06-02. Retrieved 2014-06-01.
- "Carlow County Council Local Election". Irish Independent. Archived from the original on 2014-06-02. Retrieved 2014-06-01.
Carlow
| Carlow - 10 seats | |||||||||||||||||||
|---|---|---|---|---|---|---|---|---|---|---|---|---|---|---|---|---|---|---|---|
| Party | Candidate | FPv% | Count 1 | Count 2 | Count 3 | Count 4 | Count 5 | Count 6 | Count 7 | Count 8 | Count 9 | Count 10 | Count 11 | Count 12 | Count 13 | Count 14 | Count 15 | ||
| Fianna Fáil | Jennifer Murnane O'Connor*† | 13.04 | 1,530 | ||||||||||||||||
| Fianna Fáil | John Pender* | 11.54 | 1,354 | ||||||||||||||||
| Sinn Féin | John Cassin | 9.18 | 1,077 | ||||||||||||||||
| Fine Gael | Brian O'Donoghue | 8.68 | 1,018 | 1,025 | 1,073 | ||||||||||||||
| Fianna Fáil | Fintan Phelan | 8.62 | 1,011 | 1,128 | |||||||||||||||
| Sinn Féin | Jim Deane | 7.18 | 842 | 878 | 900 | 902 | 908 | 909 | 917 | 940 | 961 | 981 | 1,042 | 1,174 | |||||
| Fianna Fáil | Ann Ahern née Long*†† | 5.76 | 676 | 769 | 827 | 852 | 853 | 854 | 858 | 873 | 874 | 916 | 961 | 981 | 987 | 1,007 | 1,063 | ||
| Independent | Walter Lacey* | 5.39 | 632 | 680 | 689 | 696 | 697 | 697 | 708 | 738 | 793 | 852 | 894 | 971 | 1,013 | 1,039 | 1,116 | ||
| Labour Party | William Paton* | 5.20 | 610 | 617 | 694 | 695 | 695 | 697 | 699 | 704 | 712 | 738 | 794 | 818 | 828 | 1,022 | 1,046 | ||
| Fine Gael | Fergal Browne* | 4.64 | 544 | 563 | 575 | 578 | 578 | 578 | 579 | 583 | 610 | 621 | 654 | 662 | 664 | 728 | 912 | ||
| Fine Gael | Wayne Fennell* | 3.87 | 454 | 468 | 472 | 475 | 475 | 475 | 475 | 479 | 494 | 502 | 529 | 537 | 537 | 552 | |||
| Fine Gael | Tom O'Neill* | 3.52 | 413 | 436 | 439 | 444 | 445 | 445 | 446 | 454 | 461 | 489 | 522 | 532 | 533 | 568 | 686 | ||
| Fine Gael | Kathy Walsh | 3.11 | 365 | 369 | 401 | 401 | 401 | 402 | 404 | 409 | 412 | 415 | 429 | 436 | 439 | ||||
| Anti-Austerity Alliance | Ned Costigan | 2.47 | 290 | 301 | 306 | 307 | 308 | 309 | 315 | 366 | 385 | 391 | 402 | ||||||
| Labour Party | Caroline Townsend* | 2.40 | 281 | 309 | 317 | 323 | 323 | 323 | 325 | 331 | 337 | 391 | |||||||
| Labour Party | Des Hurley* | 1.90 | 223 | 256 | 258 | 260 | 260 | 260 | 265 | 270 | 282 | 282 | |||||||
| Independent | Declan Alcock | 1.64 | 192 | 202 | 206 | 209 | 209 | 209 | 216 | 224 | |||||||||
| Direct Democracy | Saoire O'Brien | 1.41 | 166 | 173 | 175 | 177 | 177 | 177 | 182 | ||||||||||
| Independent | Pat Finnerty | 0.27 | 32 | 33 | 33 | 33 | 33 | 33 | 33 | ||||||||||
| Independent | Conor Dowling | 0.19 | 22 | 27 | 28 | 29 | 29 | 29 | 29 | ||||||||||
| Electorate: 23,431 Valid: 11,732 (50.07%) Spoilt: 139 Quota: 1,067 Turnout: 11,871 (50.66%) | |||||||||||||||||||
Muinebheag
| Muinebheag - 8 seats | ||||||||||||||||
|---|---|---|---|---|---|---|---|---|---|---|---|---|---|---|---|---|
| Party | Candidate | FPv% | Count 1 | Count 2 | Count 3 | Count 4 | Count 5 | Count 6 | Count 7 | Count 8 | Count 9 | Count 10 | Count 11 | Count 12 | ||
| Independent | Charlie Murphy* | 14.14 | 1,377 | |||||||||||||
| Fine Gael | Tommy Kinsella* | 11.60 | 1,130 | |||||||||||||
| Labour Party | Willie Quinn* | 10.66 | 1,038 | 1,066 | 1,083 | |||||||||||
| Sinn Féin | Andy Gladney | 8.26 | 804 | 825 | 827 | 840 | 858 | 885 | 926 | 974 | 1,176 | |||||
| Fianna Fáil | Arthur McDonald* | 8.09 | 788 | 803 | 806 | 809 | 851 | 863 | 1,018 | 1,032 | 1,081 | 1,099 | ||||
| Fine Gael | Michael Doran* | 7.90 | 769 | 775 | 777 | 790 | 805 | 814 | 838 | 882 | 939 | 949 | 950 | 1,107 | ||
| Fine Gael | John Murphy* | 5.79 | 564 | 610 | 619 | 630 | 634 | 683 | 686 | 751 | 756 | 760 | 760 | 827 | ||
| Fine Gael | Denis Foley* | 5.66 | 551 | 564 | 570 | 578 | 620 | 629 | 664 | 683 | 727 | 747 | 752 | 824 | ||
| Fianna Fáil | P.J. Kavanagh | 5.05 | 492 | 536 | 538 | 566 | 567 | 598 | 634 | 668 | 701 | 711 | 712 | 777 | ||
| Labour Party | Jim Townsend* | 4.73 | 461 | 474 | 475 | 486 | 516 | 554 | 586 | 639 | 678 | 698 | 701 | |||
| Anti-Austerity Alliance | Christy Cormac | 4.49 | 437 | 447 | 448 | 459 | 481 | 492 | 523 | 586 | ||||||
| Fianna Fáil | David O'Brien | 3.66 | 356 | 367 | 368 | 376 | 399 | 407 | ||||||||
| Independent | Matthew English-Hayden | 3.42 | 333 | 356 | 357 | 390 | 395 | |||||||||
| Independent | Billy Nolan | 2.68 | 261 | 303 | 304 | 322 | 324 | 324 | ||||||||
| Labour Party | Ken Hickey | 2.23 | 217 | 220 | 220 | 222 | ||||||||||
| Independent | Liam Foley | 1.37 | 133 | 150 | 151 | |||||||||||
| Independent | Pat Finnerty | 0.29 | 28 | 30 | 30 | |||||||||||
| Electorate: 17,599 Valid: 9,739 (55.46%) Spoilt: 139 Quota: 1,083 Turnout: 9,878 (56.26%) | ||||||||||||||||
References
Changes since 2014
- † Carlow Fianna Fáil Cllr Jennifer Murnane-O'Connor was elected to Seanad Éireann in April 2016. Her brother, Ken, was co-opted to fill the vacancy on 9 June 2016.
- †† Carlow Fianna Fáil Cllr Anne Ahern née Long resigned her seat on 11 September 2017 upon being appointed a School Principal. On 9 October 2017 Andrea Dalton was co-opted to fill the vacancy.
External links
| Preceded by 2009 Carlow County Council election |
Carlow County Council elections | Succeeded by 2019 Carlow County Council election |