2014–15 Football Conference
The 2014–15 Football Conference season is the eleventh season with the Conference consisting of three divisions and the thirty-fifth season overall. The Conference covers the top two levels of Non-League football in England. The Conference Premier is the fifth highest level of the overall pyramid, whilst the Conference North and Conference South exist at the sixth level. The top team and the winner of the play-off of the Premier division will be promoted to Football League Two, while the bottom four are relegated to the North or South divisions. The champions of the North and South divisions will be promoted to the Premier division, alongside the play-off winners from each division. The bottom three in each of the North and South divisions are relegated to the premier divisions of the Northern Premier League, Isthmian League or Southern League.
| Season | 2014–15 |
|---|---|
← 2013–14 2015–16 → | |
Barnet returned the Football League as champions after two seasons in the Conference, while playoff winners Bristol Rovers returned after a single season, their only season outside the Football League since being admitted in 1920.
Conference Premier
| Season | 2014–15 |
|---|---|
| Champions | Barnet |
| Promoted | Barnet Bristol Rovers |
| Relegated | Alfreton Town Telford United Dartford Nuneaton Town |
| Matches played | 552 |
| Goals scored | 1,486 (2.69 per match) |
| Top goalscorer | John Akinde (31 goals) |
| Biggest home win | Grimsby Town 7–0 Alfreton Town Bristol Rovers 7–0 Alfreton Town |
| Biggest away win | Chester 0–5 Barnet Gateshead 1–6 Grimsby Town |
| Highest scoring | Nuneaton Town 4–4 Telford United Forest Green Rovers 5–3 Southport Chester 5–3 Nuneaton Town |
| Longest winning run | 6 games[1] Torquay United |
| Longest unbeaten run | 20 games[1] Bristol Rovers |
| Longest winless run | 11 games[1] Telford United Welling United |
| Longest losing run | 8 games[1] Welling United |
← 2013–14 2015–16 → | |
Promotion and relegation
Teams promoted from 2013–14 Conference North
- AFC Telford United (League Champions)
- Altrincham (Play-off Winners)
Teams promoted from 2013–14 Conference South
- Eastleigh (League Champions)
- Dover Athletic (Play-off Winners)
Teams relegated from 2013–14 Football League Two
Expelled from Conference National
League table
| Pos | Team | Pld | W | D | L | GF | GA | GD | Pts | Promotion, qualification or relegation |
|---|---|---|---|---|---|---|---|---|---|---|
| 1 | Barnet (C, P) | 46 | 28 | 8 | 10 | 94 | 46 | +48 | 92 | Promotion to Football League Two |
| 2 | Bristol Rovers (O, P) | 46 | 25 | 16 | 5 | 73 | 34 | +39 | 91 | Qualification to Conference Premier play-offs[lower-alpha 1] |
| 3 | Grimsby Town | 46 | 25 | 11 | 10 | 74 | 40 | +34 | 86 | |
| 4 | Eastleigh | 46 | 24 | 10 | 12 | 87 | 61 | +26 | 82 | |
| 5 | Forest Green Rovers[lower-alpha 2] | 46 | 22 | 16 | 8 | 80 | 54 | +26 | 79 | |
| 6 | Macclesfield Town | 46 | 21 | 15 | 10 | 60 | 46 | +14 | 78 | |
| 7 | Woking | 46 | 21 | 13 | 12 | 77 | 52 | +25 | 76 | |
| 8 | Dover Athletic | 46 | 19 | 11 | 16 | 69 | 58 | +11 | 68 | |
| 9 | Halifax Town | 46 | 17 | 15 | 14 | 60 | 54 | +6 | 66 | |
| 10 | Gateshead | 46 | 17 | 15 | 14 | 66 | 62 | +4 | 66 | |
| 11 | Wrexham | 46 | 17 | 15 | 14 | 56 | 52 | +4 | 66 | |
| 12 | Chester | 46 | 19 | 6 | 21 | 64 | 76 | −12 | 63 | |
| 13 | Torquay United | 46 | 16 | 13 | 17 | 64 | 60 | +4 | 61 | |
| 14 | Braintree Town | 46 | 18 | 5 | 23 | 56 | 57 | −1 | 59 | |
| 15 | Lincoln City | 46 | 16 | 10 | 20 | 62 | 71 | −9 | 58 | |
| 16 | Kidderminster Harriers | 46 | 15 | 12 | 19 | 51 | 60 | −9 | 57 | |
| 17 | Altrincham | 46 | 16 | 8 | 22 | 54 | 73 | −19 | 56 | |
| 18 | Aldershot Town | 46 | 14 | 11 | 21 | 51 | 61 | −10 | 53 | |
| 19 | Southport | 46 | 13 | 12 | 21 | 47 | 72 | −25 | 51 | |
| 20 | Welling United | 46 | 11 | 12 | 23 | 52 | 73 | −21 | 45 | |
| 21 | Alfreton Town (R) | 46 | 12 | 9 | 25 | 49 | 90 | −41 | 45 | Relegation to National League North/National League South |
| 22 | Dartford (R) | 46 | 8 | 15 | 23 | 44 | 74 | −30 | 39 | |
| 23 | Telford United[lower-alpha 3] (R) | 46 | 10 | 9 | 27 | 58 | 84 | −26 | 36 | |
| 24 | Nuneaton Town[lower-alpha 4] (R) | 46 | 10 | 9 | 27 | 38 | 76 | −38 | 36 |
Rules for classification: 1) Points; 2) Goal difference; 3) Number of goals scored
(C) Champion; (O) Play-off winner; (P) Promoted; (R) Relegated.
Notes:
- Four teams play for one spot and promotion to Football League Two.
- Forest Green were deducted three points for fielding an ineligible player in their win over Southport on 9 August 2014.[4]
- Telford were deducted three points for fielding an ineligible player in their win over Lincoln City on 11 April 2015.[5]
- Nuneaton were deducted three points for fielding an ineligible player in their win over Welling United on 28 February 2015.[6]
Play-offs
| Semifinals | Final | |||||||||
| 2 | Bristol Rovers | 1 | 2 | 3 | ||||||
| 5 | Forest Green Rovers | 0 | 0 | 0 | ||||||
| 2 | Bristol Rovers (a.e.t.) | 1 (5) | ||||||||
| 3 | Grimsby Town | 1 (3) | ||||||||
| 3 | Grimsby Town | 2 | 3 | 5 | ||||||
| 4 | Eastleigh | 1 | 0 | 1 | ||||||
First leg
| 29 April 2015[7] | Forest Green Rovers | 0–1 | Bristol Rovers | The New Lawn, Nailsworth |
| 19:45 | Report | Taylor |
Referee: Lee Swabey |
Second leg
| 3 May 2015[7] | Bristol Rovers | 2–0 (3–0 agg.) | Forest Green Rovers | Memorial Stadium, Bristol |
| 12:45 | Lines Taylor |
Report | Attendance: 10,536 Referee: Darren England |
| 3 May 2015[7] | Grimsby Town | 3–0 (5–1 agg.) | Eastleigh | Blundell Park, Cleethorpes |
| 15:30 | Palmer John-Lewis |
Report | Attendance: 6,286 Referee: Ben Toner |
Final
| 17 May 2015[7] | Bristol Rovers | 1–1 (a.e.t.) (5–3 p) | Grimsby Town | Wembley Stadium, London |
| 14:00 | Harrison |
Report | John-Lewis |
Attendance: 47,029 |
| Penalties | ||||
Results
Stadia and locations
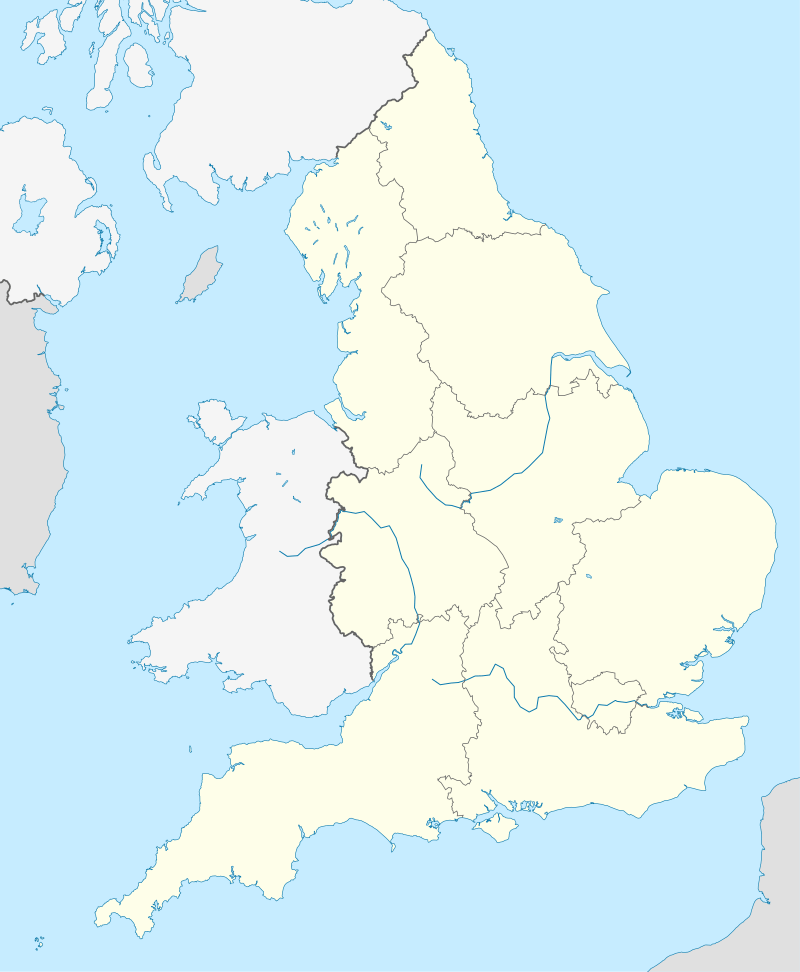
| Team | Stadium | Capacity |
|---|---|---|
| A.F.C. Telford United | New Bucks Head | 6,300 |
| Aldershot Town | EBB Stadium | 7,100 |
| Alfreton Town | North Street | 3,600 |
| Altrincham | Moss Lane | 6,085 |
| Barnet | The Hive Stadium | 5,100 |
| Braintree Town | Cressing Road | 4,202 |
| Bristol Rovers | Memorial Stadium | 12,011 |
| Chester | Deva Stadium | 6,000 |
| Dartford | Princes Park | 4,100 |
| Dover Athletic | Crabble Athletic Ground | 6,500 |
| Eastleigh | Silverlake Stadium | 5,200 |
| F.C. Halifax Town | The Shay | 14,061 |
| Forest Green Rovers | The New Lawn | 5,147 |
| Gateshead | Gateshead International Stadium | 10,000 |
| Grimsby Town | Blundell Park | 9,546 |
| Kidderminster Harriers | Aggborough | 6,238 |
| Lincoln City | Sincil Bank | 10,120 |
| Macclesfield Town | Moss Rose | 6,355 |
| Nuneaton Town | Liberty Way | 4,314 |
| Southport | Haig Avenue | 6,008 |
| Torquay United | Plainmoor | 6,500 |
| Welling United | Park View Road | 4,000 |
| Woking | Kingfield Stadium | 6,036 |
| Wrexham | Racecourse Ground | 10,771 |
Top scorers
- As of 18 April 2015.[8]
| Rank | Player | Club | Goals |
|---|---|---|---|
| 1 | John Akinde | Barnet | 31 |
| 2 | Jon Parkin | Forest Green Rovers | 25 |
| 3 | Scott Rendell | Woking | 24 |
| 4 | James Constable | Eastleigh | 18 |
| Tony Gray | AFC Telford United | ||
| Damian Reeves | Altrincham | ||
| Matty Taylor | Bristol Rovers | ||
| 8 | Lenell John-Lewis | Grimsby Town | 16 |
| Louis Moult | Wrexham | ||
| 10 | Stefan Payne | Dover Athletic | 15 |
| Brett Williams | Aldershot Town |
Conference North
Promotion and relegation
Teams promoted from 2013–14 Northern Premier League Premier Division
Teams promoted from 2013–14 Isthmian League Premier Division
- Lowestoft Town (Play-off Winners)
Teams relegated from 2013–14 Conference Premier
- Tamworth
- Hyde
League table
| Pos | Team | Pld | W | D | L | GF | GA | GD | Pts | Promotion, qualification or relegation |
|---|---|---|---|---|---|---|---|---|---|---|
| 1 | Barrow (C, P) | 42 | 26 | 9 | 7 | 81 | 43 | +38 | 87 | Promotion to National League |
| 2 | AFC Fylde | 42 | 25 | 10 | 7 | 93 | 43 | +50 | 85 | Qualification to Conference North play-offs[lower-alpha 1] |
| 3 | Boston United | 42 | 20 | 12 | 10 | 75 | 51 | +24 | 72 | |
| 4 | Chorley | 42 | 20 | 11 | 11 | 76 | 55 | +21 | 71 | |
| 5 | Guiseley (O, P) | 42 | 20 | 10 | 12 | 68 | 49 | +19 | 70 | |
| 6 | Oxford City | 42 | 20 | 9 | 13 | 81 | 67 | +14 | 69 | Transferred to National League South |
| 7 | Tamworth | 42 | 19 | 12 | 11 | 66 | 57 | +9 | 69 | |
| 8 | Hednesford Town | 42 | 17 | 10 | 15 | 63 | 50 | +13 | 61 | |
| 9 | Worcester City | 42 | 16 | 12 | 14 | 54 | 54 | 0 | 60 | |
| 10 | North Ferriby United | 42 | 14 | 16 | 12 | 65 | 63 | +2 | 58 | |
| 11 | Stockport County | 42 | 16 | 9 | 17 | 56 | 59 | −3 | 57 | |
| 12 | Solihull Moors | 42 | 16 | 7 | 19 | 68 | 63 | +5 | 55 | |
| 13 | Bradford Park Avenue | 42 | 14 | 11 | 17 | 52 | 66 | −14 | 53 | |
| 14 | Gloucester City | 42 | 14 | 10 | 18 | 63 | 75 | −12 | 52 | |
| 15 | Harrogate Town | 42 | 14 | 10 | 18 | 50 | 62 | −12 | 52 | |
| 16 | Lowestoft Town | 42 | 12 | 15 | 15 | 54 | 66 | −12 | 51 | |
| 17 | Gainsborough Trinity | 42 | 14 | 8 | 20 | 59 | 67 | −8 | 50 | |
| 18 | Brackley Town | 42 | 13 | 8 | 21 | 39 | 62 | −23 | 47 | |
| 19 | Stalybridge Celtic | 42 | 12 | 9 | 21 | 54 | 70 | −16 | 45 | |
| 20 | Colwyn Bay (R) | 42 | 11 | 12 | 19 | 59 | 82 | −23 | 45 | Relegation to Northern Premier League, Southern Football League or Isthmian League |
| 21 | Leamington (R) | 42 | 10 | 10 | 22 | 59 | 74 | −15 | 40 | |
| 22 | Hyde (R) | 42 | 3 | 12 | 27 | 49 | 106 | −57 | 21 |
Rules for classification: 1) Points; 2) Goal difference; 3) Number of goals scored
(C) Champion; (O) Play-off winner; (P) Promoted; (R) Relegated.
Notes:
- Four teams play for one spot and promotion to National League.
Play-offs
| Semifinals | Final | |||||||||
| 2 | AFC Fylde | 0 | 1 | 1 | ||||||
| 5 | Guiseley | 1 | 2 | 3 | ||||||
| 4 | Chorley | 2 | ||||||||
| 5 | Guiseley | 3 | ||||||||
| 3 | Boston United | 0 | 2 | 2 (4) | ||||||
| 4 | Chorley (a.e.t.) | 0 | 2 | 2 (5) | ||||||
First leg
| 29 April 2015[7] | Chorley | 0–0 | Boston United | Victory Park, Chorley |
| 19:45 |
Second leg
| 2 May 2015[7] | AFC Fylde | 1–2 (1–3 agg.) | Guiseley | Kellamergh Park, Fylde |
| 15:00 | Allen |
Boshell Holdsworth |
| 2 May 2015[7] | Boston United | 2–2 (a.e.t.) (2–2 agg.) (4–5 p) | Chorley | York Street, Boston |
| 15:00 | Garner Felix |
Doyle Roscoe |
||
| Penalties | ||||
Final
Results
Stadia and locations
| Team | Stadium | Capacity |
|---|---|---|
| A.F.C. Fylde | Kellamergh Park | 3,180 |
| Barrow | Holker Street | 5,000 |
| Boston United | York Street | 6,643 |
| Brackley Town | St. James Park | 3,500 |
| Bradford Park Avenue | Horsfall Stadium | 3,500 |
| Chorley | The Chorley Group Victory Park Stadium | 4,100 |
| Colwyn Bay | Llanelian Road | 2,500 |
| Gainsborough Trinity | The Northolme | 4,304 |
| Gloucester City | Whaddon Road | 7,066 |
| Guiseley | Nethermoor Park | 3,000 |
| Harrogate Town | Wetherby Road | 3,800 |
| Hednesford Town | Keys Park | 6,500 |
| Hyde | Ewen Fields | 4,250 |
| Leamington | New Windmill Ground | 2,300 |
| Lowestoft Town | Crown Meadow | 3,000 |
| North Ferriby United | Grange Lane | 2,700 |
| Oxford City | Court Place Farm | 2,000 |
| Solihull Moors | Damson Park | 3,050 |
| Stalybridge Celtic | Bower Fold | 6,500 |
| Stockport County | Edgeley Park | 10,841 |
| Tamworth | The Lamb Ground | 4,000 |
| Worcester City | Aggborough | 6,302 |
Top scorers
- As of 25 April 2015.[9]
| Rank | Player | Club | Goals |
|---|---|---|---|
| 1 | Omar Bogle | Solihull Moors | 29 |
| 2 | Dayle Southwell | Boston United | 28 |
| 3 | Daniel Rowe | AFC Fylde | 26 |
| Adi Yussuf | Oxford City | ||
| 5 | Adam Boyes | Guiseley | 23 |
| Andy Cook | Barrow | ||
| 7 | Ritchie Allen | AFC Fylde | 20 |
| James Dean | Chorley | ||
| 9 | Obi Anoruo | Colwyn Bay | 18 |
| Tom Denton | North Ferriby United |
Conference South
Promotion and relegation
Teams promoted from 2013–14 Isthmian League Premier Division
- Wealdstone (League Champions)
Teams promoted from 2013–14 Southern League Premier Division
- Hemel Hempstead Town (League Champions)
- St Albans City (Play-off Winners)
The division ran one club short due to the expulsion of Salisbury City.
League table
| Pos | Team | Pld | W | D | L | GF | GA | GD | Pts | Promotion, qualification or relegation |
|---|---|---|---|---|---|---|---|---|---|---|
| 1 | Bromley (C, P) | 40 | 23 | 8 | 9 | 79 | 46 | +33 | 77 | Promotion to National League |
| 2 | Boreham Wood (O, P) | 40 | 23 | 6 | 11 | 79 | 44 | +35 | 75 | Qualification to Conference South play-offs[lower-alpha 1] |
| 3 | Basingstoke Town | 40 | 22 | 7 | 11 | 67 | 43 | +24 | 73 | |
| 4 | Whitehawk | 40 | 22 | 6 | 12 | 62 | 47 | +15 | 72 | |
| 5 | Havant & Waterlooville | 40 | 21 | 7 | 12 | 61 | 41 | +20 | 70 | |
| 6 | Gosport Borough | 40 | 19 | 10 | 11 | 63 | 40 | +23 | 67 | |
| 7 | Concord Rangers | 40 | 18 | 11 | 11 | 60 | 44 | +16 | 65 | |
| 8 | Ebbsfleet United | 40 | 17 | 9 | 14 | 60 | 41 | +19 | 60 | |
| 9 | Hemel Hempstead Town | 40 | 16 | 12 | 12 | 64 | 60 | +4 | 60 | |
| 10 | Chelmsford City | 40 | 17 | 5 | 18 | 65 | 71 | −6 | 56 | |
| 11 | Eastbourne Borough | 40 | 14 | 13 | 13 | 51 | 50 | +1 | 55 | |
| 12 | Wealdstone | 40 | 14 | 12 | 14 | 56 | 56 | 0 | 54 | |
| 13 | St Albans City | 40 | 16 | 6 | 18 | 53 | 53 | 0 | 54 | |
| 14 | Bath City | 40 | 15 | 8 | 17 | 59 | 57 | +2 | 53 | |
| 15 | Sutton United | 40 | 13 | 11 | 16 | 50 | 54 | −4 | 50 | |
| 16 | Bishop's Stortford | 40 | 12 | 10 | 18 | 55 | 69 | −14 | 46 | |
| 17 | Weston-super-Mare | 40 | 13 | 5 | 22 | 55 | 86 | −31 | 44 | |
| 18 | Maidenhead United | 40 | 10 | 13 | 17 | 54 | 70 | −16 | 43 | |
| 19 | Hayes & Yeading United | 40 | 11 | 9 | 20 | 39 | 58 | −19 | 42 | |
| 20 | Farnborough (R) | 40 | 8 | 6 | 26 | 42 | 101 | −59 | 30 | Relegation to Northern Premier League, Southern Football League or Isthmian League |
| 21 | Staines Town (R) | 40 | 7 | 4 | 29 | 39 | 82 | −43 | 25 |
Rules for classification: 1) Points; 2) Goal difference; 3) Number of goals scored
(C) Champion; (O) Play-off winner; (P) Promoted; (R) Relegated.
Notes:
- Four teams play for one spot and promotion to National League.
Play-offs
| Semifinals | Final | |||||||||
| 2 | Boreham Wood | 2 | 2 | 4 | ||||||
| 5 | Havant & Waterlooville | 0 | 2 | 2 | ||||||
| 2 | Boreham Wood (a.e.t.) | 2 | ||||||||
| 4 | Whitehawk | 1 | ||||||||
| 3 | Basingstoke Town | 1 | 0 | 1 | ||||||
| 4 | Whitehawk | 1 | 1 | 2 | ||||||
First leg
| 29 April 2015[7] | Havant & Waterlooville | 0–2 | Boreham Wood | West Leigh Park, Havant |
| 19:45 | Morais Montgomery |
| 29 April 2015[7] | Whitehawk | 1–1 | Basingstoke Town | The Enclosed Ground, Whitehawk |
| 19:45 | Robinson |
Flood |
Second leg
| 2 May 2015[7] | Boreham Wood | 2–2 (4–2 agg.) | Havant & Waterlooville | Meadow Park, Borehamwood |
| 15:00 | Shakes Angol |
Dutton Mullings |
| 2 May 2015[7] | Basingstoke Town | 0–1 (1–2 agg.) | Whitehawk | The Camrose, Basingstoke |
| 15:00 | Robinson |
Final
| 9 May 2015[7] | Boreham Wood | 2–1 (a.e.t.) | Whitehawk | Meadow Park, Borehamwood |
| 15:00 | Angol Morais |
Deering |
Results
Stadia and locations
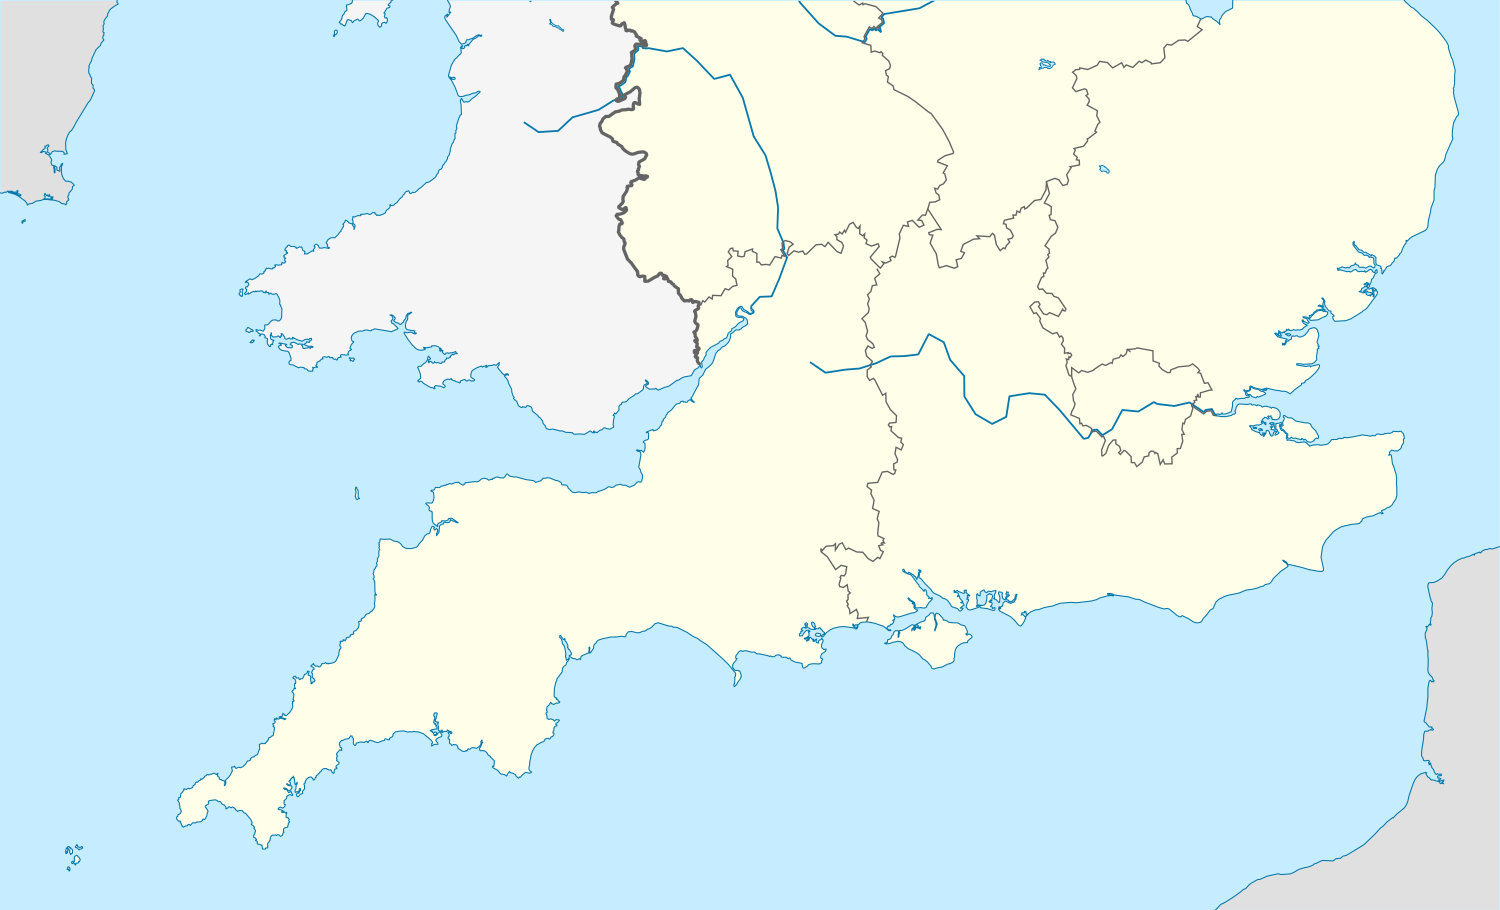
| Team | Stadium | Capacity |
|---|---|---|
| Basingstoke Town | The Camrose | 6,000 |
| Bath City | Mayday Trust Park | 8,840 |
| Bishop's Stortford | ProKit UK Stadium | 4,525 |
| Boreham Wood | Meadow Park | 4,502 |
| Bromley | Hayes Lane | 6,000 |
| Chelmsford City | Melbourne Stadium | 3,019 |
| Concord Rangers | Thames Road | 1,500 |
| Eastbourne Borough | Priory Lane | 4,134 |
| Ebbsfleet United | Stonebridge Road | 5,011 |
| Farnborough | Paddy Power Park | 4,000 |
| Gosport Borough | Privett Park | 4,500 |
| Havant & Waterlooville | West Leigh Park | 5,250 |
| Hayes & Yeading United | York Road | 3,000 |
| Hemel Hempstead Town | Vauxhall Road | 3,152 |
| Maidenhead United | York Road | 3,000 |
| St Albans City | Clarence Park | 4,500 |
| Staines Town | Wheatsheaf Park | 3,009 |
| Sutton United | Gander Green Lane | 5,013 |
| Wealdstone | The Vale | 2,640 |
| Weston-super-Mare | Woodspring Stadium | 3,500 |
| Whitehawk | The Enclosed Ground | 2,000 |
Top scorers
- As of 25 April 2015.[10]
| Rank | Player | Club | Goals |
|---|---|---|---|
| 1 | Justin Bennett | Gosport Borough | 24 |
| 2 | Lee Angol | Boreham Wood | 23 |
| 3 | Jordan Parkes | Hemel Hempstead Town | 20 |
| Dave Tarpey | Maidenhead United | ||
| 5 | Danny Mills | Whitehawk | 18 |
| David Pratt | Bath City | ||
| 7 | Jake Robinson | Whitehawk | 17 |
| 8 | Moses Ademola | Bromley | 15 |
| Michael Cheek | Chelmsford City | ||
| Scott Donnelly | Havant & Waterlooville | ||
| Matt Paterson | Gosport Borough |
References
- "English Conference 2014–15". Retrieved 26 April 2015.
- Hereford expelled from Football Conference
- Salisbury demoted down to Conference South
- "Forest Green deducted three points for fielding ineligible player". BBC Sport. 26 September 2014. Retrieved 19 December 2014.
- "Telford United: Relegated Conference club docked points". BBC Sport. 13 May 2015. Retrieved 13 May 2015.
- "Nuneaton Town docked points for fielding ineligible player". BBC Sport. 7 April 2015. Retrieved 7 April 2015.
- "The Official Football Conference League Website". footballconference.co.uk/. Archived from the original on 2014-02-07. Retrieved 2015-04-25.
- "Football Conference Top Scorers". BBC. Retrieved 5 October 2014.
- "Football Conference Top Scorers". BBC. Archived from the original on 2015-06-15. Retrieved 1 March 2015.
- "Football Conference Top Scorers". BBC. Retrieved 1 March 2015.