2009–10 Southern Football League
The 2009–10 season was the 107th in the history of the Southern League, which is an English football competition featuring semi-professional and amateur clubs from the South West, South Central and Midlands of England and South Wales.
At the end of the previous season Division One Midlands was renamed Division One Central.
Premier Division
The Premier Division consisted of 22 clubs, including 17 clubs from the previous season and five new clubs:
- Two clubs promoted from Division One Midlands:
- Leamington
- Nuneaton Town
- Two clubs promoted from Division One South & West:
- Plus:
- Hednesford Town, transferred from Northern Premier League
Farnborough won the Premier Division and were promoted to the Conference South, while play-off winners Nuneaton Town achieved the second promotion in two seasons after club reorganization to return in Conference.
Clevedon Town and Rugby Town were the only clubs relegated this season, while Merthyr Tydfil were expelled from the league after failing to meet a FA deadline to give assurances that they could trade effectively during 2010–11, liquidated and reborn under the name Merthyr Town three divisions below Southern League Premier Division. Tiverton Town and Hemel Hempstead Town were reprieved from relegation due to clubs higher up the pyramid folded and demoted.
League table
| Season | 2009–10 |
|---|---|
| Champions | Farnborough |
| Promoted | Farnborough Nuneaton Town |
| Relegated | Clevedon Town Rugby Town |
| Matches played | 462 |
| Goals scored | 1,439 (3.11 per match) |
| Top goalscorer | Stefan Moore (Halesowen Town) - 35 |
| Biggest home win | Hednesford Town 6 – 0 Rugby Town, 5 April 2010 Stourbridge 6 – 0 Rugby Town, 17 April 2010 |
| Biggest away win | Swindon Supermarine 0 – 7 Farnborough, 28 November 2009 |
| Highest scoring | Stourbridge 7 – 0 Truro City, 5 December 2009 |
| Highest attendance | 1765 (Nuneaton Town 1 – 1 Farnborough, 10 April 2010) |
| Lowest attendance | 80 (Clevedon Town 1 – 2 Oxford City, 20 April 2010) |
| Average attendance | 348 |
← 2008–09 2010–11 → | |
| Pos | Team | Pld | W | D | L | GF | GA | GD | Pts | Promotion or relegation |
|---|---|---|---|---|---|---|---|---|---|---|
| 1 | Farnborough | 42 | 28 | 9 | 5 | 100 | 44 | +56 | 93 | Promoted to the Conference South |
| 2 | Nuneaton Town | 42 | 26 | 10 | 6 | 91 | 37 | +54 | 88 | Qualified for the play-offs, then promoted to the Conference North |
| 3 | Chippenham Town | 42 | 21 | 11 | 10 | 67 | 43 | +24 | 74 | Qualified for the play-offs |
| 4 | Hednesford Town | 42 | 20 | 13 | 9 | 79 | 51 | +28 | 73 | |
| 5 | Brackley Town | 42 | 21 | 9 | 12 | 83 | 61 | +22 | 72 | |
| 6 | Cambridge City | 42 | 18 | 17 | 7 | 73 | 44 | +29 | 71 | |
| 7 | Bashley | 42 | 20 | 11 | 11 | 79 | 61 | +18 | 71 | |
| 8 | Halesowen Town | 42 | 21 | 17 | 4 | 84 | 53 | +31 | 70[lower-alpha 1] | |
| 9 | Stourbridge | 42 | 19 | 13 | 10 | 80 | 65 | +15 | 70 | |
| 10 | Leamington | 42 | 19 | 8 | 15 | 84 | 75 | +9 | 65 | |
| 11 | Truro City | 42 | 17 | 11 | 14 | 78 | 65 | +13 | 62 | |
| 12 | Banbury United | 42 | 14 | 13 | 15 | 53 | 67 | −14 | 55 | |
| 13 | Oxford City | 42 | 13 | 15 | 14 | 63 | 66 | −3 | 54 | |
| 14 | Swindon Supermarine | 42 | 10 | 14 | 18 | 48 | 76 | −28 | 44 | |
| 15 | Didcot Town | 42 | 10 | 11 | 21 | 56 | 70 | −14 | 41 | |
| 16 | Evesham United | 42 | 9 | 14 | 19 | 35 | 52 | −17 | 41 | |
| 17 | Merthyr Tydfil | 42 | 12 | 11 | 19 | 62 | 72 | −10 | 37[lower-alpha 1] | Expelled after the end of the season, and folded |
| 18 | Bedford Town | 42 | 9 | 10 | 23 | 50 | 88 | −38 | 37 | |
| 19 | Tiverton Town | 42 | 8 | 12 | 22 | 35 | 61 | −26 | 36 | Reprieved from relegation |
| 20 | Hemel Hempstead Town | 42 | 8 | 10 | 24 | 50 | 81 | −31 | 34 | |
| 21 | Clevedon Town | 42 | 6 | 11 | 25 | 48 | 92 | −44 | 29 | Relegated to Division One South & West |
| 22 | Rugby Town | 42 | 4 | 8 | 30 | 41 | 114 | −73 | 20 | Relegated to Division One Central |
Rules for classification: 1) points; 2) goal difference; 3) number of goals scored.
Notes:
- Merthyr Tydfil and Halesowen Town deducted 10 points for entering administration
Play-offs
| Semifinals | Final | ||||||||
| 2 | Nuneaton Town | 6 | |||||||
| 5 | Brackley Town | 0 | |||||||
| 2 | Nuneaton Town | 2 | |||||||
| 3 | Chippenham Town | 1 | |||||||
| 3 | Chippenham Town | 2 | |||||||
| 4 | Hednesford Town | 0 | |||||||
Results
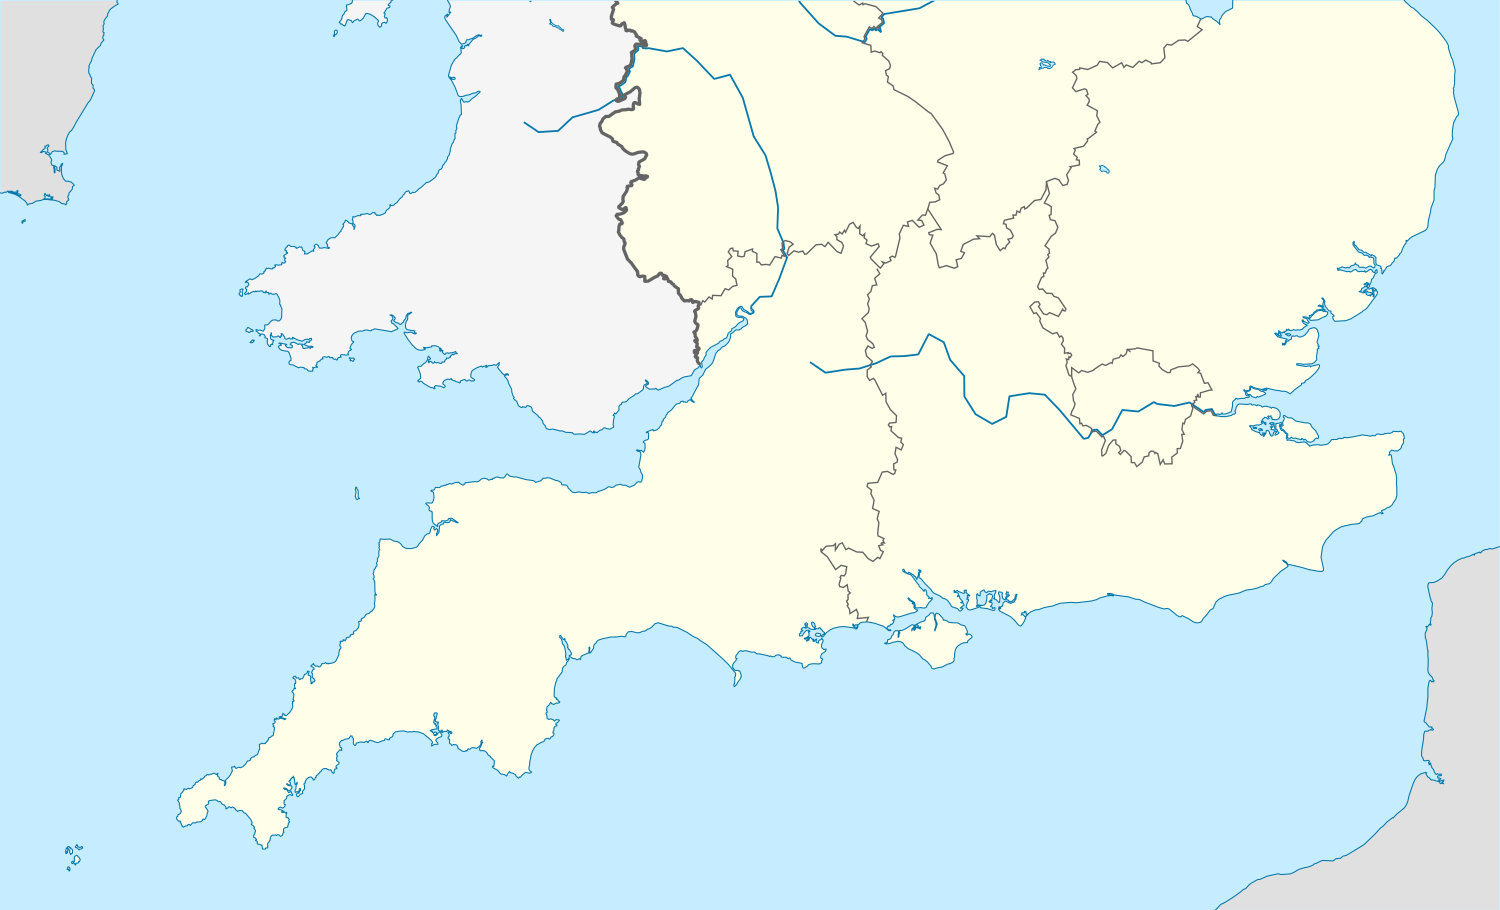
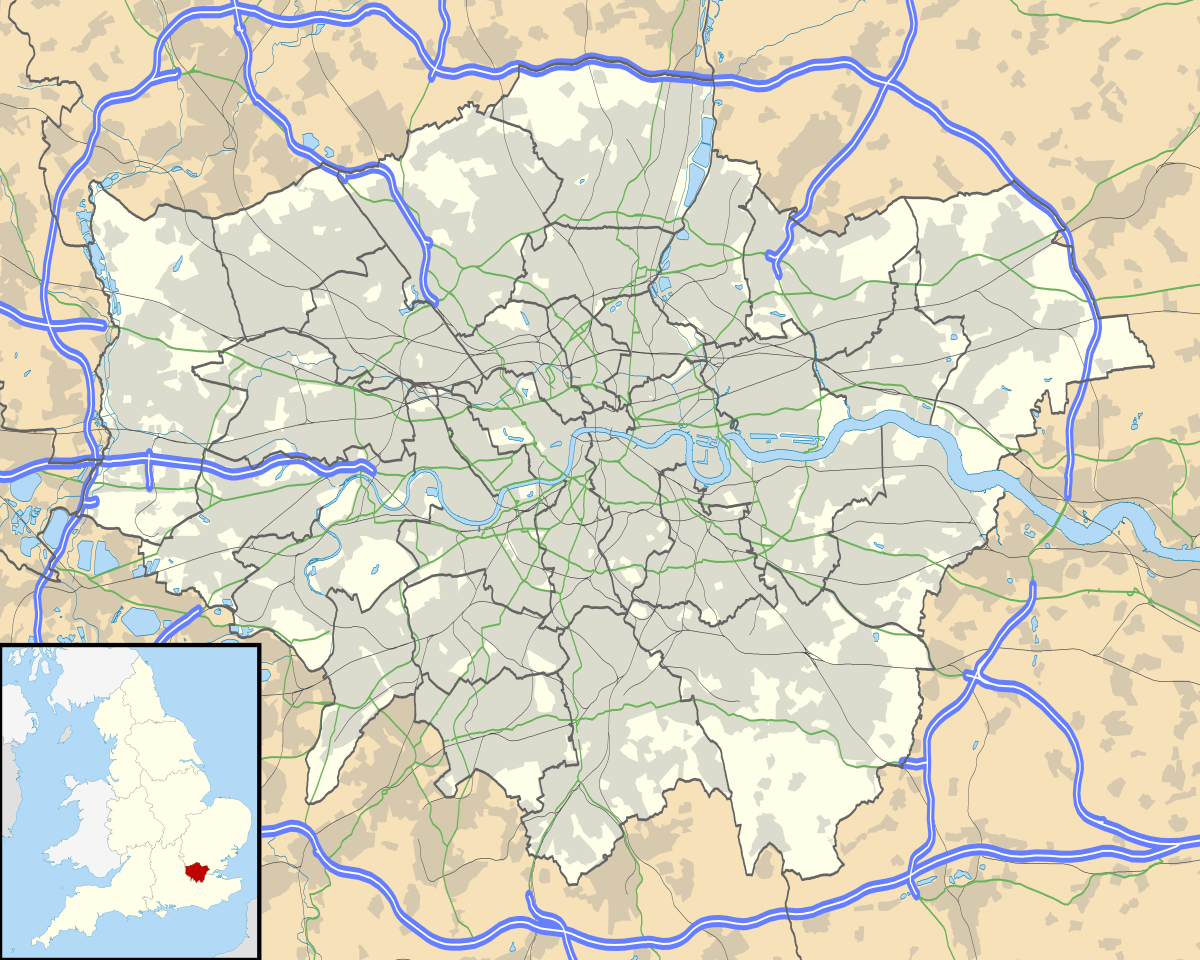
Stadia and locations
| Club | Stadium | Capacity |
|---|---|---|
| Banbury United | Spencer Stadium | 2,000 |
| Bashley | Bashley Road | 2,000 |
| Bedford Town | The Eyrie | 3,000 |
| Brackley Town | St. James Park | 3,500 |
| Cambridge City | City Ground | 2,300 |
| Chippenham Town | Hardenhuish Park | 2,815 |
| Clevedon Town | Hand Stadium | 3,500 |
| Didcot Town | Draycott Engineering Loop Meadow Stadium | 3,000 |
| Evesham United | St George's Lane (groundshare with Worcester City) | 3,000 |
| Farnborough | Cherrywood Road | 7,000 |
| Halesowen Town | The Grove | 5,000 |
| Hednesford Town | Keys Park | 6,039 |
| Hemel Hempstead Town | Vauxhall Road | 3,152 |
| Leamington | New Windmill Ground | 3,000 |
| Merthyr Tydfil | Penydarren Park | 4,500 |
| Nuneaton Borough | Liberty Way | 4,614 |
| Oxford City | Court Place Farm | 2,000 |
| Rugby Town | Butlin Road | 6,000 |
| Stourbridge | War Memorial Athletic Ground | 2,626 |
| Swindon Supermarine | Hunts Copse Ground | 3,000 |
| Tiverton Town | Ladysmead | 3,500 |
| Truro City | Treyew Road | 3,200 |
Division One Central
The division was renamed at the end of the previous season and consisted of 22 clubs, including 17 clubs from previous season Midland division and five new clubs:
- Three clubs transferred from Division One South & West:
- Beaconsfield SYCOB
- Burnham
- Slough Town
- Plus:
- Biggleswade Town, promoted from the Spartan South Midlands League
- Hitchin Town, relegated from the Premier Division
Bury Town won the division in their second season in the Southern League and returned to the Isthmian League to take a place in Premier Division, while play-off winners Chesham United went back to Southern League Premier Division after three seasons of absence. Aylesbury United finished bottom of the table and were relegated to the lower leagues along with Rothwell United who resigned from the league at the end of the season. Thus, Barton Rovers finished second bottom were reprieved from relegation.
League table
| Season | 2009–10 |
|---|---|
| Champions | Bury Town |
| Promoted | Bury Town Chesham United |
| Relegated | Aylesbury United |
| Matches played | 462 |
| Goals scored | 1,462 (3.16 per match) |
| Top goalscorer | Jamie Arlick (Hitchin Town) - 29 |
| Biggest home win | Sutton Coldfield Town 6 – 0 Soham Town Rangers, 5 December 2009 Bury Town 8 – 2 Barton Rovers, 8 December 2009 |
| Biggest away win | Rothwell Town 0 – 7 Biggleswade Town, 13 April 2010 |
| Highest scoring | Leighton Town 6 – 4 AFC Sudbury, 26 September 2009 Bury Town 8 – 2 Barton Rovers, 8 December 2009 |
| Highest attendance | 1550 (Bury Town 3 – 0 Marlow, 24 April 2010) |
| Lowest attendance | 40 (Woodford United 1 – 3 Burnham, 2 March 2010) |
| Average attendance | 167 |
← 2008–09 2010–11 → | |
| Pos | Team | Pld | W | D | L | GF | GA | GD | Pts | Promotion or relegation |
|---|---|---|---|---|---|---|---|---|---|---|
| 1 | Bury Town | 42 | 32 | 6 | 4 | 115 | 40 | +75 | 102 | Promoted to IL Premier Division |
| 2 | Hitchin Town | 42 | 31 | 7 | 4 | 91 | 36 | +55 | 100 | Qualified for play-offs |
| 3 | Burnham | 42 | 26 | 9 | 7 | 67 | 43 | +24 | 87 | |
| 4 | Chesham United | 42 | 24 | 8 | 10 | 76 | 41 | +35 | 80 | Qualified for play-offs, then promoted to the Premier Division |
| 5 | Slough Town | 42 | 23 | 8 | 11 | 87 | 54 | +33 | 77 | Qualified for play-offs |
| 6 | Sutton Coldfield Town | 42 | 22 | 11 | 9 | 93 | 61 | +32 | 77 | Transferred to NPL Division One South |
| 7 | Woodford United | 42 | 18 | 8 | 16 | 70 | 68 | +2 | 62 | |
| 8 | Romulus | 42 | 16 | 13 | 13 | 66 | 48 | +18 | 61 | Transferred to NPL Division One South |
| 9 | Arlesey Town | 42 | 17 | 10 | 15 | 58 | 48 | +10 | 61 | |
| 10 | Leighton Town | 42 | 18 | 6 | 18 | 63 | 66 | −3 | 60 | |
| 11 | Soham Town Rangers | 42 | 17 | 7 | 18 | 73 | 80 | −7 | 58 | |
| 12 | Biggleswade Town | 42 | 14 | 13 | 15 | 56 | 63 | −7 | 55 | |
| 13 | Atherstone Town | 42 | 15 | 9 | 18 | 65 | 82 | −17 | 54 | |
| 14 | AFC Sudbury | 42 | 13 | 12 | 17 | 55 | 54 | +1 | 51 | Transferred to IL Division One North |
| 15 | Marlow | 42 | 12 | 14 | 16 | 64 | 65 | −1 | 50 | |
| 16 | Bedworth United | 42 | 12 | 11 | 19 | 59 | 72 | −13 | 47 | |
| 17 | Stourport Swifts | 42 | 11 | 10 | 21 | 63 | 69 | −6 | 43 | Transferred to Division One South & West |
| 18 | Rothwell Town | 42 | 11 | 8 | 23 | 53 | 80 | −27 | 41 | Resigned at the end of the season |
| 19 | Beaconsfield SYCOB | 42 | 8 | 8 | 26 | 46 | 96 | −50 | 32 | |
| 20 | Bromsgrove Rovers | 42 | 8 | 15 | 19 | 45 | 68 | −23 | 29[lower-alpha 1] | Transferred to Division One South & West |
| 21 | Barton Rovers | 42 | 6 | 9 | 27 | 49 | 95 | −46 | 27 | Reprieved from relegation |
| 22 | Aylesbury United | 42 | 4 | 6 | 32 | 48 | 133 | −85 | 18 | Relegated to the Spartan South Midlands League |
Rules for classification: 1) points; 2) goal difference; 3) number of goals scored.
Notes:
- Bromsgrove Rovers deducted 10 points for entering administration
Play-offs
| Semifinals | Final | ||||||||
| 2 | Hitchin Town | 1 | |||||||
| 5 | Slough Town | 2 | |||||||
| 4 | Chesham United | 4 | |||||||
| 5 | Slough Town | 0 | |||||||
| 3 | Burnham | 0 | |||||||
| 4 | Chesham United | 1 | |||||||
Results
Stadia and locations
| Club | Stadium | Capacity |
|---|---|---|
| AFC Sudbury | King's Marsh | 3,800 |
| Arlesey Town | Hitchin Road | 2,920 |
| Atherstone Town | Sheepy Road | 3,500 |
| Aylesbury United | Bell Close (groundshare with Leighton Town) | 2,800 |
| Barton Rovers | Sharpenhoe Road | 4,000 |
| Beaconsfield SYCOB | Holloways Park | 3,500 |
| Bedworth United | The Oval | 3,000 |
| Biggleswade Town | The Carlsberg Stadium | 3,000 |
| Bromsgrove Rovers | Victoria Ground | 4,893 |
| Burnham | The Gore | 2,500 |
| Bury Town | Ram Meadow | 3,500 |
| Chesham United | The Meadow | 5,000 |
| Hitchin Town | Top Field | 4,000 |
| Leighton Town | Bell Close | 2,800 |
| Marlow | Alfred Davis Memorial Ground | 3,000 |
| Romulus | The Central Ground (groundshare with Sutton Coldfield Town) | 2,000 |
| Rothwell Town | Cecil Street | 3,500 |
| Slough Town | Holloways Park (groundshare with Beaconsfield SYCOB) | 3,500 |
| Soham Town Rangers | Julius Martin Lane | 2,000 |
| Stourport Swifts | Walshes Meadow | 2,000 |
| Sutton Coldfield Town | The Central Ground | 2,000 |
| Woodford United | Byfield Road | 3,000 |
Division One South & West
Division One South & West consisted of 22 clubs, including 16 clubs from previous season and six new clubs:
- Bedfont Green, promoted from the Combined Counties League
- Frome Town, promoted from the Western League
- Hungerford Town, promoted from the Hellenic League
- Mangotsfield United, relegated from the Premier Division
- VT, promoted from the Wessex League
- Yate Town, relegated from the Premier Division
Windsor & Eton won the division and got a place in Premier Division along with play-off winners Cirencester Town, who returned there at the second push. A.F.C. Hayes finished second bottom but were reprieved from relegation due to higher league clubs problems. Thus, Bracknell Town, finished bottom of the table, were the only club relegated to the lower league this season.
League table
| Season | 2009–10 |
|---|---|
| Champions | Windsor & Eton |
| Promoted | Windsor & Eton Cirencester Town |
| Relegated | Bracknell Town |
| Matches played | 462 |
| Goals scored | 1,551 (3.36 per match) |
| Top goalscorer | Justin Bennett (Gosport Borough) - 32 |
| Biggest home win | Cirencester Town 11 – 1 Bracknell Town, 17 April 2010 |
| Biggest away win | Bracknell Town 0 – 9 North Leigh, 23 March 2010 |
| Highest scoring | Cirencester Town 11 – 1 Bracknell Town, 17 April 2010 |
| Highest attendance | 1016 (Bridgwater Town 1 – 0 Taunton Town, 1 January 2010) |
| Lowest attendance | 28 (Bedfont Green 0 – 2 North Leigh, 13 April 2010) (Bracknell Town 0 – 4 Bishops Cleeve, 22 April 2010) |
| Average attendance | 138 |
← 2008–09 2010–11 → | |
| Pos | Team | Pld | W | D | L | GF | GA | GD | Pts | Promotion or relegation |
|---|---|---|---|---|---|---|---|---|---|---|
| 1 | Windsor & Eton | 42 | 31 | 8 | 3 | 84 | 20 | +64 | 101 | Promoted to the Premier Division |
| 2 | AFC Totton | 42 | 32 | 4 | 6 | 105 | 36 | +69 | 100 | Qualified for the play-offs |
| 3 | Bridgwater Town | 42 | 26 | 11 | 5 | 83 | 30 | +53 | 89 | |
| 4 | VT | 42 | 25 | 7 | 10 | 90 | 52 | +38 | 82 | |
| 5 | Cirencester Town | 42 | 23 | 9 | 10 | 91 | 46 | +45 | 78 | Qualified for the play-offs, then promoted to the Premier Division |
| 6 | Frome Town | 42 | 20 | 15 | 7 | 68 | 44 | +24 | 75 | |
| 7 | Paulton Rovers | 42 | 20 | 10 | 12 | 73 | 58 | +15 | 70 | |
| 8 | Gosport Borough | 42 | 19 | 10 | 13 | 80 | 59 | +21 | 66[lower-alpha 1] | |
| 9 | Mangotsfield United | 42 | 19 | 5 | 18 | 77 | 66 | +11 | 62 | |
| 10 | North Leigh | 42 | 18 | 7 | 17 | 83 | 72 | +11 | 61 | |
| 11 | Bishop's Cleeve | 42 | 15 | 13 | 14 | 64 | 64 | 0 | 58 | |
| 12 | Thatcham Town | 42 | 17 | 6 | 19 | 76 | 72 | +4 | 57 | |
| 13 | Yate Town | 42 | 15 | 10 | 17 | 58 | 64 | −6 | 55 | |
| 14 | Abingdon United | 42 | 15 | 7 | 20 | 65 | 84 | −19 | 52 | |
| 15 | Uxbridge | 42 | 14 | 6 | 22 | 70 | 85 | −15 | 48 | Transferred to Division One Central |
| 16 | Cinderford Town | 42 | 13 | 8 | 21 | 66 | 78 | −12 | 47 | |
| 17 | Bedfont Green | 42 | 12 | 8 | 22 | 77 | 90 | −13 | 44 | Transferred to Division One Central |
| 18 | Taunton Town | 42 | 11 | 7 | 24 | 50 | 85 | −35 | 40 | |
| 19 | Andover | 42 | 9 | 11 | 22 | 54 | 85 | −31 | 38 | |
| 20 | Hungerford Town | 42 | 13 | 6 | 23 | 53 | 68 | −15 | 33[lower-alpha 2] | |
| 21 | A.F.C. Hayes | 42 | 7 | 4 | 31 | 55 | 105 | −50 | 25 | Reprieved from relegation, then transferred to Division One Central |
| 22 | Bracknell Town | 42 | 2 | 0 | 40 | 29 | 187 | −158 | 6 | Relegated to the Hellenic League |
Rules for classification: 1) points; 2) goal difference; 3) number of goals scored.
Notes:
- Gosport Borough deducted 1 point for fielding ineligible players
- Hungerford Town deducted 12 points for fielding ineligible player
Play-offs
| Semifinals | Final | ||||||||
| 2 | AFC Totton | 2 | |||||||
| 5 | Cirencester Town | 3 | |||||||
| 3 | Bridgwater Town | 3 | |||||||
| 5 | Cirencester Town | 4* | |||||||
| 3 | Bridgwater Town | 3 | |||||||
| 4 | VT | 0 | |||||||
* after extra time
Results
Stadia and locations
| Club | Stadium | Capacity |
|---|---|---|
| A.F.C. Hayes | Farm Park | 1,500 |
| AFC Totton | Testwood Stadium | 3,000 |
| Abingdon United | Northcourt Road | 2,000 |
| Andover | Portway Stadium | 3,000 |
| Bedfont Town | The Orchard | 2,100 |
| Bishops Cleeve | Kayte Lane | 1,500 |
| Bracknell Town | Larges Lane | 2,500 |
| Bridgwater Town | Fairfax Park | 2,500 |
| Cinderford Town | Causeway Ground | 3,500 |
| Cirencester Town | Corinium Stadium | 4,500 |
| Frome Town | Badgers Hill | 2,000 |
| Gosport Borough | Privett Park | 4,500 |
| Hungerford Town | Bulpit Lane | 2,500 |
| Mangotsfield United | Cossham Street | 2,500 |
| North Leigh | Eynsham Hall Park Sports Ground | 2,000 |
| Paulton Rovers | Athletic Field | 2,500 |
| VT | Universal Stadium | 1,000 |
| Taunton Town | Wordsworth Drive | 2,500 |
| Thatcham Town | Waterside Park | 1,500 |
| Uxbridge | Honeycroft | 3,770 |
| Windsor & Eton | Stag Meadow | 4,500 |
| Yate Town | Lodge Road | 2,000 |