2007 East Hampshire District Council election
The 2007 East Hampshire District Council election took place on 3 May 2007 to elect members of East Hampshire District Council in Hampshire England. The whole council was up for election and the Conservative party stayed in overall control of the council.[1]
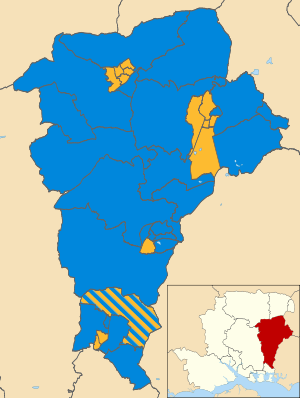
Map of the results of the 2007 East Hampshire council election. Conservatives in blue and Liberal Democrats in yellow.
Election result
| Party | Seats | Gains | Losses | Net gain/loss | Seats % | Votes % | Votes | +/− | |
|---|---|---|---|---|---|---|---|---|---|
| Conservative | 30 | 2 | 0 | +2 | 68.2 | 60.6 | 23,667 | +7.1% | |
| Liberal Democrats | 14 | 0 | 2 | -2 | 31.8 | 35.1 | 13,725 | -5.9% | |
| Labour | 0 | 0 | 0 | 0 | 0 | 3.7 | 1,433 | -0.7% | |
| Independent | 0 | 0 | 0 | 0 | 0 | 0.6 | 249 | -0.2% | |
3 Conservative and 3 Liberal Democrat candidates were unopposed at the election.[3]
Ward results
| Party | Candidate | Votes | % | ± | |
|---|---|---|---|---|---|
| Liberal Democrats | Tony Ludlow | 357 | 57.4 | +0.8 | |
| Conservative | Glynis Watts | 192 | 30.9 | +3.5 | |
| Labour | Peter Treacher | 73 | 11.7 | -4.3 | |
| Majority | 165 | 26.5 | -2.8 | ||
| Turnout | 622 | 33.1 | +2.0 | ||
| Liberal Democrats hold | Swing | ||||
| Party | Candidate | Votes | % | ± | |
|---|---|---|---|---|---|
| Conservative | Andrew Joy | 489 | 61.1 | +8.2 | |
| Liberal Democrats | Robert Saunders | 263 | 32.9 | -14.2 | |
| Labour | Barbara Burfoot | 48 | 6.0 | +6.0 | |
| Majority | 226 | 28.3 | +22.4 | ||
| Turnout | 800 | 43.3 | +5.3 | ||
| Conservative hold | Swing | ||||
| Party | Candidate | Votes | % | ± | |
|---|---|---|---|---|---|
| Liberal Democrats | Pamela Bradford | 275 | 53.7 | -4.7 | |
| Conservative | Chris Butler | 182 | 35.5 | +10.9 | |
| Labour | Janice Treacher | 55 | 10.7 | -6.3 | |
| Majority | 93 | 18.2 | -15.5 | ||
| Turnout | 512 | 24.7 | +0.3 | ||
| Liberal Democrats hold | Swing | ||||
| Party | Candidate | Votes | % | ± | |
|---|---|---|---|---|---|
| Liberal Democrats | John Smith | 438 | 60.9 | -9.3 | |
| Conservative | Jacqueline Saunders | 281 | 39.1 | +9.3 | |
| Majority | 157 | 21.8 | -18.5 | ||
| Turnout | 719 | 33.9 | +3.4 | ||
| Liberal Democrats hold | Swing | ||||
| Party | Candidate | Votes | % | ± | |
|---|---|---|---|---|---|
| Liberal Democrats | Allan Chick | 517 | 54.1 | +3.2 | |
| Conservative | Barry Hope | 386 | 40.4 | -8.7 | |
| Labour | Roger Godber | 52 | 5.4 | +5.4 | |
| Majority | 131 | 13.7 | +11.9 | ||
| Turnout | 955 | 42.7 | +1.1 | ||
| Liberal Democrats hold | Swing | ||||
| Party | Candidate | Votes | % | ± | |
|---|---|---|---|---|---|
| Liberal Democrats | Jerry Janes | unopposed | |||
| Liberal Democrats hold | Swing | ||||
| Party | Candidate | Votes | % | ± | |
|---|---|---|---|---|---|
| Conservative | Ken Carter | 796 | 80.2 | ||
| Liberal Democrats | Jonathan Heard | 196 | 19.8 | ||
| Majority | 600 | 60.5 | |||
| Turnout | 992 | 45.2 | |||
| Conservative hold | Swing | ||||
| Party | Candidate | Votes | % | ± | |
|---|---|---|---|---|---|
| Conservative | Anna James | 1,230 | |||
| Conservative | Sam James | 1,172 | |||
| Conservative | Evelyn Hope | 1,146 | |||
| Liberal Democrats | Rob Evans | 819 | |||
| Liberal Democrats | James Walters | 771 | |||
| Liberal Democrats | David Raison | 737 | |||
| Labour | Peter Dare | 196 | |||
| Labour | John Tough | 186 | |||
| Turnout | 6,257 | 34.3 | +6.2 | ||
| Conservative hold | Swing | ||||
| Conservative hold | Swing | ||||
| Conservative hold | Swing | ||||
| Party | Candidate | Votes | % | ± | |
|---|---|---|---|---|---|
| Liberal Democrats | Sam Payne | 820 | |||
| Conservative | Ken Moon | 782 | |||
| Liberal Democrats | Peters Rodgers | 781 | |||
| Conservative | Dave Harvey | 668 | |||
| Turnout | 3,051 | 41.6 | +9.7 | ||
| Liberal Democrats hold | Swing | ||||
| Conservative gain from Liberal Democrats | Swing | ||||
| Party | Candidate | Votes | % | ± | |
|---|---|---|---|---|---|
| Conservative | Patrick Burridge | 667 | 70.6 | -0.9 | |
| Liberal Democrats | Jimmy Patel | 278 | 29.4 | +0.9 | |
| Majority | 389 | 41.2 | -1.8 | ||
| Turnout | 945 | 49.8 | +9.7 | ||
| Conservative hold | Swing | ||||
| Party | Candidate | Votes | % | ± | |
|---|---|---|---|---|---|
| Conservative | David Parkinson | unopposed | |||
| Conservative hold | Swing | ||||
| Party | Candidate | Votes | % | ± | |
|---|---|---|---|---|---|
| Conservative | Patricia Seward | 1,298 | |||
| Conservative | Maurice Johnson | 1,287 | |||
| Liberal Democrats | John Hopkin | 687 | |||
| Liberal Democrats | Jacky Powers | 676 | |||
| Turnout | 3,948 | 48.0 | +3.0 | ||
| Conservative hold | Swing | ||||
| Conservative hold | Swing | ||||
| Party | Candidate | Votes | % | ± | |
|---|---|---|---|---|---|
| Conservative | Jennifer Gray | unopposed | |||
| Conservative hold | Swing | ||||
| Party | Candidate | Votes | % | ± | |
|---|---|---|---|---|---|
| Conservative | Ferris Cowper | 707 | 85.1 | +0.1 | |
| Liberal Democrats | Nicholas James | 124 | 14.9 | +14.9 | |
| Majority | 583 | 70.2 | +0.2 | ||
| Turnout | 831 | 43.0 | +3.5 | ||
| Conservative hold | Swing | ||||
| Party | Candidate | Votes | % | ± | |
|---|---|---|---|---|---|
| Conservative | Anthony Williams | 1,094 | |||
| Conservative | Richard Millard | 1,040 | |||
| Liberal Democrats | Richard Clifford | 563 | |||
| Liberal Democrats | Gary Hopwood | 493 | |||
| Turnout | 3,190 | 37.7 | +6.7 | ||
| Conservative hold | Swing | ||||
| Conservative hold | Swing | ||||
| Party | Candidate | Votes | % | ± | |
|---|---|---|---|---|---|
| Conservative | David O'Donnell | 632 | 68.3 | +13.4 | |
| Liberal Democrats | Roger Fitzer | 220 | 23.8 | +1.1 | |
| Independent | Brian Nonhebel | 74 | 8.0 | -6.2 | |
| Majority | 412 | 44.5 | +12.2 | ||
| Turnout | 926 | 43.2 | +1.4 | ||
| Conservative hold | Swing | ||||
| Party | Candidate | Votes | % | ± | |
|---|---|---|---|---|---|
| Conservative | Sara Schillemore | 414 | 65.8 | +8.5 | |
| Liberal Democrats | Sarah McEwan | 215 | 34.2 | -8.5 | |
| Majority | 199 | 31.6 | +16.9 | ||
| Turnout | 629 | 33.1 | -0.5 | ||
| Conservative hold | Swing | ||||
| Party | Candidate | Votes | % | ± | |
|---|---|---|---|---|---|
| Conservative | Julia Marshall | 348 | 50.7 | +17.6 | |
| Liberal Democrats | Daphne Giddings | 339 | 49.3 | -17.6 | |
| Majority | 9 | 1.3 | |||
| Turnout | 687 | 34.9 | +0.4 | ||
| Conservative gain from Liberal Democrats | Swing | ||||
| Party | Candidate | Votes | % | ± | |
|---|---|---|---|---|---|
| Conservative | Dorothy Denston | 536 | 75.6 | +2.0 | |
| Liberal Democrats | Ian Maiden | 173 | 24.4 | -2.0 | |
| Majority | 363 | 51.2 | +4.0 | ||
| Turnout | 709 | 36.4 | +6.5 | ||
| Conservative hold | Swing | ||||
| Party | Candidate | Votes | % | ± | |
|---|---|---|---|---|---|
| Liberal Democrats | Ken Graham | 511 | 62.2 | ||
| Conservative | William Gordon | 310 | 37.8 | ||
| Majority | 201 | 24.5 | |||
| Turnout | 821 | 33.7 | |||
| Liberal Democrats hold | Swing | ||||
| Party | Candidate | Votes | % | ± | |
|---|---|---|---|---|---|
| Liberal Democrats | Mike Ashton | 333 | 52.3 | -15.3 | |
| Conservative | Christine Kittredge | 304 | 47.7 | +15.3 | |
| Majority | 29 | 4.6 | -30.7 | ||
| Turnout | 637 | 34.0 | +7.0 | ||
| Liberal Democrats hold | Swing | ||||
| Party | Candidate | Votes | % | ± | |
|---|---|---|---|---|---|
| Conservative | Yvonne Parker-Smith | 450 | 74.6 | +6.4 | |
| Liberal Democrats | Liz King | 153 | 25.4 | -6.4 | |
| Majority | 297 | 49.3 | +13.0 | ||
| Turnout | 603 | 33.5 | +4.2 | ||
| Conservative hold | Swing | ||||
| Party | Candidate | Votes | % | ± | |
|---|---|---|---|---|---|
| Conservative | Elizabeth Cartwright | 1,171 | |||
| Conservative | Gina Logan | 1,088 | |||
| Labour | Howard Linsley | 298 | |||
| Labour | Leslie Hammond | 297 | |||
| Turnout | 2,854 | 38.7 | +0.7 | ||
| Conservative hold | Swing | ||||
| Conservative hold | Swing | ||||
| Party | Candidate | Votes | % | ± | |
|---|---|---|---|---|---|
| Conservative | John West | 396 | 53.2 | +8.8 | |
| Liberal Democrats | Roger Mullenger | 311 | 41.8 | +4.5 | |
| Labour | Moira Johnson | 37 | 5.0 | -13.3 | |
| Majority | 85 | 11.4 | +4.3 | ||
| Turnout | 744 | 39.8 | +8.1 | ||
| Conservative hold | Swing | ||||
| Party | Candidate | Votes | % | ± | |
|---|---|---|---|---|---|
| Liberal Democrats | Anne Claxton | 364 | 46.7 | -3.3 | |
| Conservative | Robert Matthews | 346 | 44.4 | +4.6 | |
| Labour | Bill Organ | 69 | 8.9 | -1.3 | |
| Majority | 18 | 2.3 | -7.9 | ||
| Turnout | 779 | 43.1 | +6.0 | ||
| Liberal Democrats hold | Swing | ||||
| Party | Candidate | Votes | % | ± | |
|---|---|---|---|---|---|
| Conservative | Julie Butler | 353 | 55.5 | -0.1 | |
| Liberal Democrats | Phillip Humphries | 283 | 44.5 | +0.1 | |
| Majority | 70 | 11.0 | -0.3 | ||
| Turnout | 636 | 38.4 | +1.5 | ||
| Conservative hold | Swing | ||||
| Party | Candidate | Votes | % | ± | |
|---|---|---|---|---|---|
| Conservative | Bob Ayer | unopposed | |||
| Conservative hold | Swing | ||||
| Party | Candidate | Votes | % | ± | |
|---|---|---|---|---|---|
| Conservative | Guy Stacpoole | 557 | 62.1 | -12.8 | |
| Liberal Democrats | Jonathan Coninx | 218 | 24.3 | +24.3 | |
| Labour | Christine Straw | 122 | 13.6 | -11.5 | |
| Majority | 339 | 37.8 | -11.9 | ||
| Turnout | 897 | 44.1 | +1.1 | ||
| Conservative hold | Swing | ||||
| Party | Candidate | Votes | % | ± | |
|---|---|---|---|---|---|
| Conservative | Hilary Ayer | 396 | 71.2 | +6.4 | |
| Liberal Democrats | Alex Pinhorn | 160 | 28.8 | -6.4 | |
| Majority | 236 | 42.4 | +12.9 | ||
| Turnout | 556 | 30.4 | -1.8 | ||
| Conservative hold | Swing | ||||
| Party | Candidate | Votes | % | ± | |
|---|---|---|---|---|---|
| Conservative | Chris Graham | 775 | 84.3 | +35.7 | |
| Liberal Democrats | Liz Ludlow | 144 | 15.7 | -35.7 | |
| Majority | 631 | 68.7 | |||
| Turnout | 919 | 52.7 | -5.9 | ||
| Conservative hold | Swing | ||||
| Party | Candidate | Votes | % | ± | |
|---|---|---|---|---|---|
| Conservative | Marge Harvey | 672 | 66.0 | +29.4 | |
| Liberal Democrats | Peter Whitaker | 346 | 34.0 | -29.4 | |
| Majority | 326 | 32.0 | |||
| Turnout | 1,018 | 49.4 | +7.8 | ||
| Conservative hold | Swing | ||||
| Party | Candidate | Votes | % | ± | |
|---|---|---|---|---|---|
| Conservative | Maureen Comber | 413 | 50.1 | -2.0 | |
| Liberal Democrats | Keith Pritchard | 412 | 49.9 | +2.0 | |
| Majority | 1 | 0.1 | -4.0 | ||
| Turnout | 825 | 46.4 | +0.8 | ||
| Conservative hold | Swing | ||||
| Party | Candidate | Votes | % | ± | |
|---|---|---|---|---|---|
| Conservative | Judy Onslow | 671 | 79.3 | ||
| Independent | Donald Jerrard | 175 | 20.7 | ||
| Majority | 496 | 58.6 | |||
| Turnout | 846 | 45.0 | |||
| Conservative hold | Swing | ||||
| Party | Candidate | Votes | % | ± | |
|---|---|---|---|---|---|
| Liberal Democrats | Zoya Faddy | unopposed | |||
| Liberal Democrats hold | Swing | ||||
| Party | Candidate | Votes | % | ± | |
|---|---|---|---|---|---|
| Liberal Democrats | Tony Muldoon | 227 | 63.4 | +2.4 | |
| Conservative | Colin Leach | 131 | 36.6 | -2.4 | |
| Majority | 96 | 26.8 | +4.8 | ||
| Turnout | 358 | 18.1 | -2.3 | ||
| Liberal Democrats hold | Swing | ||||
| Party | Candidate | Votes | % | ± | |
|---|---|---|---|---|---|
| Liberal Democrats | Philip Drury | 298 | 71.1 | -1.8 | |
| Conservative | Olivia Todd-Russett | 121 | 28.9 | +1.8 | |
| Majority | 177 | 42.2 | -3.5 | ||
| Turnout | 419 | 23.1 | -4.4 | ||
| Liberal Democrats hold | Swing | ||||
| Party | Candidate | Votes | % | ± | |
|---|---|---|---|---|---|
| Liberal Democrats | Ian Dowdle | 223 | 57.3 | -2.5 | |
| Conservative | Chris Jones | 166 | 42.7 | +2.5 | |
| Majority | 57 | 14.7 | -4.8 | ||
| Turnout | 389 | 19.4 | +5.7 | ||
| Liberal Democrats hold | Swing | ||||
| Party | Candidate | Votes | % | ± | |
|---|---|---|---|---|---|
| Liberal Democrats | Adam Carew | unopposed | |||
| Liberal Democrats hold | Swing | ||||
References
- "East Hampshire". BBC News Online. Retrieved 31 August 2011.
- "District Council election results 2007". East Hampshire District Council. Archived from the original on 27 September 2011. Retrieved 31 August 2011.
- "local Elections 2007". Local Elections Archive Project. Retrieved 1 September 2011.
This article is issued from Wikipedia. The text is licensed under Creative Commons - Attribution - Sharealike. Additional terms may apply for the media files.