2000 Emilia-Romagna regional election
The Emilia-Romagna regional election of 2000 took place on 16 April 2000.
| ||||||||||||||||||||||||||||
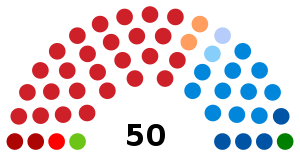
All 50 seats to the Regional Council of Emilia-Romagna | ||||||||||||||||||||||||||||
|---|---|---|---|---|---|---|---|---|---|---|---|---|---|---|---|---|---|---|---|---|---|---|---|---|---|---|---|---|
| ||||||||||||||||||||||||||||
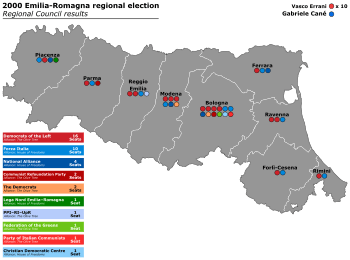 Seat totals by Province. As this is a PR election, seat totals are determined by popular vote in each province. | ||||||||||||||||||||||||||||
| ||||||||||||||||||||||||||||


 |
|---|
| This article is part of a series on the politics and government of Emilia-Romagna |
|
Vasco Errani (Democrats of the Left), who had replaced Pier Luigi Bersani in 1999, was re-elected President, defeating Gabriele Cané, the candidate of Forza Italia
Electoral Law
The Legislative Assembly of Emilia-Romagna (Assemblea Legislativa dell'Emilia-Romagna) is composed of 50 members. 40 councillors are elected in provincial constituencies by proportional representation using the largest remainder method with a Droop quota and open lists, while 10 councillors (elected in bloc) come from a "regional list", including the President-elect. One seat is reserved for the candidate who comes second. If a coalition wins more than 50% of the total seats in the Council with PR, only 5 candidates from the regional list will be chosen and the number of those elected in provincial constituencies will be 45. If the winning coalition receives less than 40% of votes special seats are added to the Council to ensure a large majority for the President's coalition.[1]
Results
 | |||||||||
| Candidates | Votes | % | Seats | Parties | Votes | % | Seats | ||
|---|---|---|---|---|---|---|---|---|---|
| Vasco Errani | 1,451,468 | 56.47 | 10 | ||||||
| Democrats of the Left | 869,242 | 36.10 | 16 | ||||||
| Communist Refoundation Party | 138,464 | 5.75 | 2 | ||||||
| The Democrats | 113,132 | 4.70 | 2 | ||||||
| PPI–RI–UpR | 70,808 | 2.94 | 1 | ||||||
| Federation of the Greens | 64,005 | 2.66 | 1 | ||||||
| Party of Italian Communists | 49,686 | 2.06 | 1 | ||||||
| Italian Democratic Socialists | 29,934 | 1.24 | – | ||||||
| Italian Republican Party | 21,625 | 0.90 | – | ||||||
| Union of Democrats for Europe | 1,363 | 0.06 | – | ||||||
| Total | 1,358,259 | 56.41 | 23 | ||||||
| Gabriele Cané | 1,036,660 | 40.33 | 1 | ||||||
| Forza Italia | 509,084 | 21.14 | 10 | ||||||
| National Alliance | 274,420 | 11.40 | 4 | ||||||
| Lega Nord Emilia–Romagna | 79,714 | 3.31 | 1 | ||||||
| Christian Democratic Centre | 47,664 | 1.98 | 1 | ||||||
| United Christian Democrats | 42,548 | 1.77 | – | ||||||
| Socialist Party | 9,507 | 0.39 | – | ||||||
| Governing Emilia Romagna | 8,094 | 0.34 | – | ||||||
| The Liberals–Sgarbi | 6,810 | 0.28 | – | ||||||
| Total | 977.841 | 40.61 | 16 | ||||||
| Sergio Stanzani | 70,655 | 2.75 | – | Bonino List | 62,611 | 2.60 | – | ||
| Carlo Rasmi | 11,447 | 0.45 | – | Popular Action | 9,080 | 0.38 | – | ||
| Total candidates | 2,570,230 | 100.00 | 11 | Total parties | 2,407,791 | 100.00 | 39 | ||
| Source: Ministry of the Interior – Historical Archive of Elections | |||||||||