1993 Nova Scotia general election
The 1993 Nova Scotia general election was held on May 25, 1993 to elect members of the 56th House of Assembly of the Province of Nova Scotia, Canada. The Liberals under John Savage won a landslide victory over the unpopular Progressive Conservatives under Premier Donald Cameron, while Alexa McDonough's NDP remained a distant third, winning three seats.
| |||||||||||||||||||||||||||||||||||||||||||||
52 seats of the Nova Scotia House of Assembly 27 seats needed for a majority | |||||||||||||||||||||||||||||||||||||||||||||
|---|---|---|---|---|---|---|---|---|---|---|---|---|---|---|---|---|---|---|---|---|---|---|---|---|---|---|---|---|---|---|---|---|---|---|---|---|---|---|---|---|---|---|---|---|---|
| |||||||||||||||||||||||||||||||||||||||||||||
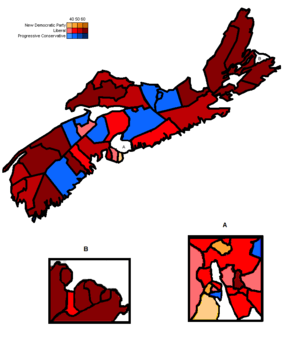 Riding map of Nova Scotia showing winning parties | |||||||||||||||||||||||||||||||||||||||||||||
| |||||||||||||||||||||||||||||||||||||||||||||

Campaign
The Progressive Conservatives, led by Donald Cameron, campaigned on his record of making 152 reforms since assuming office in 1991. Cameron slashed government spending, cutting out free coffee and rented plants in government offices.[1] John Buchanan (served 1978 to 1990) suffered allegations of patronage which Cameron could not overcome during the election campaign. Cameron vowed to end patronage and balance the budget within three years or he would resign. However, Cameron made a controversial move by appointing two unelected women to his cabinet immediately prior to the election campaign.[2]
Liberal leader John Savage promised to end pork-barrel politics and introduce a new style of governing focusing on job creation.[1]
Results
Results by party
| Party | Party leader | # of candidates |
Seats | Popular vote | ||||||
|---|---|---|---|---|---|---|---|---|---|---|
| 1988 | Dissolution | Elected | % Change | # | % | Change | ||||
| Liberal | John Savage | 52 | 21 | 21 | 40 | +90.5% | 243,298 | 49.67% | +10.1% | |
| Progressive Conservative | Donald Cameron | 52 | 28 | 24 | 9 | -62.5% | 152,383 | 31.11% | -12.3% | |
| New Democratic | Alexa McDonough | 52 | 2 | 3 | 3 | - | 85,946 | 17.55% | +1.9% | |
| Natural Law | 12 | - | - | - | - | 1,647 | 0.34% | – | ||
| Independents | 12 | 1 | 2 | - | - | 5,758 | 1.18% | - | ||
| Vacant | 2 | |||||||||
| Total | 180 | 52 | 52 | 52 | 489,829 | – | ||||
Results by region
| Party name | HRM | C.B. | Valley | S. Shore | Fundy | Central | Total | ||
|---|---|---|---|---|---|---|---|---|---|
| Parties winning seats in the legislature: | |||||||||
| Liberal | Seats: | 13 | 10 | 4 | 6 | 5 | 2 | 40 | |
| Popular vote: | 40.99% | 65.94% | 46.70% | 52.22% | 50.20% | 48.93% | 49.67% | ||
| Progressive Conservative | Seats: | 1 | - | 3 | 1 | 1 | 3 | 9 | |
| Popular vote: | 29.83% | 19.74% | 36.43% | 29.00% | 37.21% | 39.90% | 31.11% | ||
| New Democratic Party | Seats: | 3 | - | - | - | - | - | 3 | |
| Popular vote: | 27.77% | 13.72% | 12.81% | 11.91% | 13.40% | 10.47% | 17.55% | ||
| Parties not winning seats in the legislature: | |||||||||
| Natural Law | Popular vote: | 0.52% | N/A | 0.43% | N/A | N/A | N/A | 0.34% | |
| Independents | Popular vote: | 0.89% | 0.60% | 3.62% | 2.24% | 0.27% | 0.69% | 1.18% | |
| Total seats: | 17 | 10 | 7 | 7 | 6 | 5 | 52 | ||
References
- Nova Scotia Elections: A Savage sweep (Video) CBC Archives
- A Savage sweep in Nova Scotia (Article) CBC Archives
- Government of Nova Scotia. "Summary Results from 1867 to 2011" (PDF). Elections Statistics. Elections Nova Scotia. Retrieved 2013-10-01.
| General elections | |
|---|---|
| Municipal elections | |
| Referendums | |
See also: List of Nova Scotia by-elections | |