1989 Cumbria County Council election
Elections to Cumbria County Council were held on 4 May 1989. This was on the same day as other UK county council elections. The whole council of 83 members was up for election and the council remained under no overall control.
| |||||||||||||||||||||||||||||||||||||||||||||||||||||
All 83 seats of Cumbria County Council 42 seats needed for a majority | |||||||||||||||||||||||||||||||||||||||||||||||||||||
|---|---|---|---|---|---|---|---|---|---|---|---|---|---|---|---|---|---|---|---|---|---|---|---|---|---|---|---|---|---|---|---|---|---|---|---|---|---|---|---|---|---|---|---|---|---|---|---|---|---|---|---|---|---|
| |||||||||||||||||||||||||||||||||||||||||||||||||||||
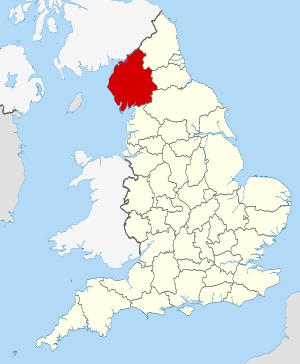 The County of Cumbria within England | |||||||||||||||||||||||||||||||||||||||||||||||||||||
| |||||||||||||||||||||||||||||||||||||||||||||||||||||
Results
| Party | Seats | Gains | Losses | Net gain/loss | Seats % | Votes % | Votes | +/− | |
|---|---|---|---|---|---|---|---|---|---|
| Labour | 37 | 44.6 | 42.3 | 59,863 | |||||
| Conservative | 37 | 44.6 | 42.1 | 59,671 | |||||
| SLD | 6 | 7.2 | 10.8 | 15,278 | |||||
| Independent | 3 | 3.6 | 4.7 | 6,623 | |||||
| Green | 0 | 0.0 | 0.1 | 152 | |||||
References
- "Local Election Summaries 1989". The Elections Centre. Retrieved 15 October 2019.
| County councils (England) |
|
|---|---|
| County councils (Wales) |
|
| District councils (Northern Ireland) |
|
| Sui generis |
|
| |
| Cumbria County Council | |
|---|---|
| Allerdale Borough Council | |
| Barrow-in-Furness Borough Council | |
| Carlisle City Council | |
| Copeland Borough Council | |
| Eden District Council | |
| South Lakeland District Council | |
| Cumberland County Council |
|
| Westmorland County Council |
|
| |
This article is issued from Wikipedia. The text is licensed under Creative Commons - Attribution - Sharealike. Additional terms may apply for the media files.