1989 Cornwall County Council election
The 1989 Cornwall County Council election to the Cornwall County Council was held on 4 May 1989, as part of the wider 1989 local elections.[2]
| |||||||||||||||||||||||||||||||||||||||||||||||||||||||||||||||||||||
All 79 seats of Cornwall County Council 40 seats needed for a majority | |||||||||||||||||||||||||||||||||||||||||||||||||||||||||||||||||||||
|---|---|---|---|---|---|---|---|---|---|---|---|---|---|---|---|---|---|---|---|---|---|---|---|---|---|---|---|---|---|---|---|---|---|---|---|---|---|---|---|---|---|---|---|---|---|---|---|---|---|---|---|---|---|---|---|---|---|---|---|---|---|---|---|---|---|---|---|---|---|
| |||||||||||||||||||||||||||||||||||||||||||||||||||||||||||||||||||||
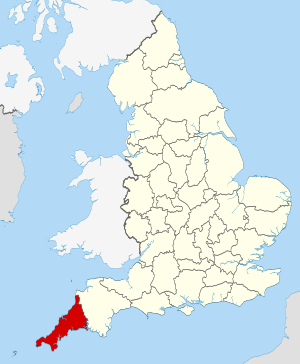 The County of Cornwall within England | |||||||||||||||||||||||||||||||||||||||||||||||||||||||||||||||||||||
| |||||||||||||||||||||||||||||||||||||||||||||||||||||||||||||||||||||
Results
| Party | Seats | Gains | Losses | Net gain/loss | Seats % | Votes % | Votes | +/− | |
|---|---|---|---|---|---|---|---|---|---|
| SLD | 32 | 40.5 | 35.2 | 49,347 | |||||
| Independent | 23 | 29.1 | 18.6 | 25,318 | |||||
| Conservative | 14 | 17.7 | 32.3 | 44,012 | |||||
| Labour | 8 | 10.1 | 8.9 | 12,112 | |||||
| Mebyon Kernow | 1 | 1.3 | 1.3 | 1,809 | |||||
| Voice of the People | 1 | 1.3 | 1.0 | 1,356 | New | ||||
| Residents | 0 | 0.0 | 1.0 | 1,342 | |||||
| SDP (1988) | 0 | 0.0 | 0.7 | 910 | New | ||||
| Monster Raving Loony | 0 | 0.0 | 0.1 | 203 | New | ||||
References
- "Local Election Summaries 1989". The Elections Centre. Retrieved 21 June 2019.
- Local Election Results 1989: Cornwall, p. 47
| County councils (England) |
|
|---|---|
| County councils (Wales) |
|
| District councils (Northern Ireland) |
|
| Sui generis |
|
| |
| Cornwall Council | |
|---|---|
| Council of the Isles of Scilly | |
| Caradon District Council |
|
| Carrick District Council |
|
| Kerrier District Council |
|
| North Cornwall District Council |
|
| Penwith District Council | |
| Restormel Borough Council | |
| |
This article is issued from Wikipedia. The text is licensed under Creative Commons - Attribution - Sharealike. Additional terms may apply for the media files.