Casti-Wergenstein
| Casti-Wergenstein | ||
|---|---|---|
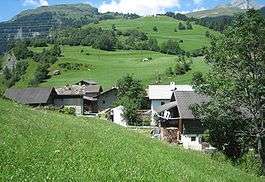 Casti | ||
| ||
 Casti-Wergenstein | ||
|
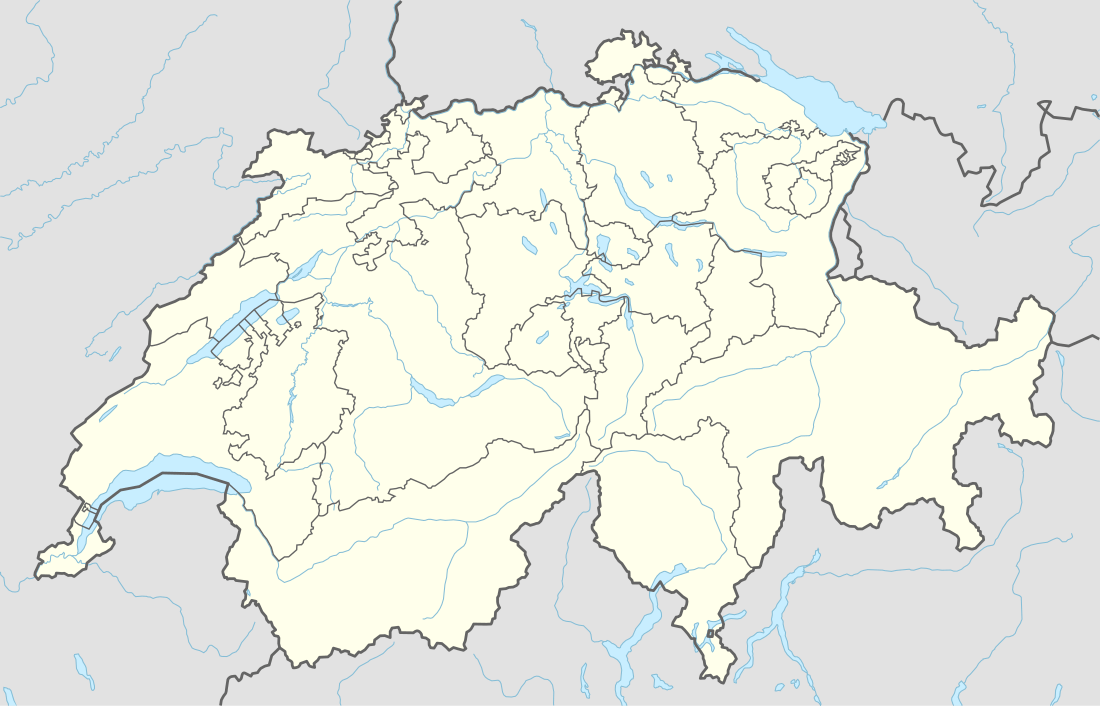
Location of Casti-Wergenstein  Casti-Wergenstein Casti-Wergenstein (Canton of Graubünden) | ||
| Coordinates: 46°37′N 9°25′E / 46.617°N 9.417°ECoordinates: 46°37′N 9°25′E / 46.617°N 9.417°E | ||
| Country | Switzerland | |
| Canton | Graubünden | |
| District | Viamala | |
| Government | ||
| • Mayor | Casper Nicca | |
| Area[1] | ||
| • Total | 25.62 km2 (9.89 sq mi) | |
| Elevation | 1,489 m (4,885 ft) | |
| Population (Dec 2016[2]) | ||
| • Total | 52 | |
| • Density | 2.0/km2 (5.3/sq mi) | |
| Postal code | 7433 | |
| SFOS number | 3703 | |
| Surrounded by | Andeer, Clugin, Donat, Mathon, Safien, Sufers | |
| Website |
http://www.casti-vargistagn.ch SFSO statistics | |

Casti-Wergenstein or Casti-Vargistagn is a municipality in the Viamala Region in the Swiss canton of Graubünden.
History
Casti-Wergenstein was created in 1923 through the union of the formerly independent municipalities of Casti and Wergenstein.[3]
Casti is first mentioned in 1204 as ad Castellum.[4] Wergenstein is first mentioned in 1219 as Vergasteno.[5]
Geography
Casti-Wergenstein has an area, (as of the 2004/09 survey) of 25.62 km2 (9.89 sq mi).[1] Of this area, about 50.0% is used for agricultural purposes, while 9.1% is forested. Of the rest of the land, 0.7% is settled (buildings or roads) and 40.2% is unproductive land. In the 2004/09 survey a total of 7 ha (17 acres) or about 0.3% of the total area was covered with buildings, an increase of 2 ha (4.9 acres) over the 1984/85 amount. Of the agricultural land, 78 ha (190 acres) is fields and grasslands and 1,224 ha (3,020 acres) consists of alpine grazing areas. Since 1984/85 the amount of agricultural land has decreased by 40 ha (99 acres). Over the same time period the amount of forested land has increased by 44 ha (110 acres). Rivers and lakes cover 24 ha (59 acres) in the municipality.[6][7]
Before 2017, the municipality was located in the Schams sub-district, of the Hinterrhein district, after 2017 it was part of the Viamala Region.[8]
Demographics
Casti-Wergenstein has a population (as of December 2016) of 52.[2] As of 2015, 7.7% of the population are resident foreign nationals. Over the last 5 years (2010-2015) the population has changed at a rate of -10.34%. The birth rate in the municipality, in 2015, was 19.4, while the death rate was 0.0 per thousand residents.[7]
As of 2015, children and teenagers (0–19 years old) make up 17.3% of the population, while adults (20–64 years old) are 67.3% of the population and seniors (over 64 years old) make up 15.4%.[7] In 2015 there were 24 single residents, 26 people who were married or in a civil partnership, widows or widowers and 2 divorced residents.[9]
In 2015 there were 21 private households in Casti-Wergenstein with an average household size of 2.48 persons. In 2015 about 66% of all buildings in the municipality were single family homes, which is much greater than the percentage in the canton (49.4%) and greater than the percentage nationally (57.4%).[10] Of the 41 inhabited buildings in the municipality, in 2000, about 68.3% were single family homes and 12.2% were multiple family buildings. Additionally, about 39.0% of the buildings were built before 1919, while 12.2% were built between 1991 and 2000.[11] In 2014 there was no new housing construction and the vacancy rate for the municipality, in 2016, was 0.0%.[7]
As of 2000, the gender distribution of the population was 55.0% male and 45.0% female.[12]
The historical population is given in the following chart:[13]
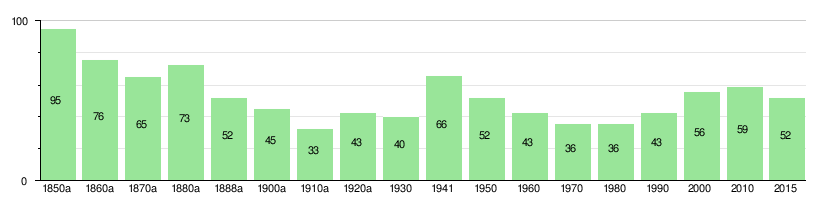
- ^a Before 1923, combined populations of Casti and Wergenstein.
Politics
In the 2015 federal election the most popular party was the SVP with 36.7% of the vote. The next three most popular parties were the FDP (21.7%), the BDP (13.3%) and the SP (10.8%). In the federal election, a total of 24 votes were cast, and the voter turnout was 58.5%. The 2015 election saw a large change in the voting when compared to 2011. The percentage of the vote received by the FDP increased sharply from 2.0% in 2011 to 21.7% in 2015, as did the SP from 5.1% to 10.8%. The percentage that the SVP received dropped from 41.8% to 36.7% and the BDP dropped from 41.8% to 13.3%.[14]
In the 2007 federal election the most popular party was the SVP which received 46.7% of the vote. The next three most popular parties were the SPS (29.6%), the CVP (12.6%) and the FDP (4.4%).[15]
Education
In Casti-Wergenstein about 82.6% of the population (between age 25-64) have completed either non-mandatory upper secondary education or additional higher education (either University or a Fachhochschule).[15]
Economy
Casti-Wergenstein is a mixed agricultural and tertiary community, a municipality where agriculture and tertiary sector play a significant role in the economy.[16]
As of 2014, there were a total of 28 people employed in the municipality. Of these, a total of 10 people worked in 4 businesses in the primary economic sector. There were no workers or businesses in the secondary sector. Finally, the tertiary sector provided 18 jobs in 5 businesses.[17]
In 2015 a total of 0.0% of the population received social assistance.[7] In 2011 the unemployment rate in the municipality was 0%.[18]
In 2015 the average cantonal, municipal and church tax rate in the municipality for a couple with two children making 80,000 SFr. was 4.2% while the rate for a single person making 150,000 SFr. was 18.3%, both of which are much higher than average for the canton or nationally. In 2013 the average income in the municipality per tax payer was 65,178 SFr. and the per person average was 28,285 SFr., which is less than the cantonal average of 69,964 SFr. and 33,075 SFr. respectively It is also less than the national per tax payer average of 82,682 SFr. and the per person average of 35,825 SFr..[19]
Languages
The municipality was once exclusively Romansh-speaking, using the Sursilvan dialect. However, since World War I, German has grown to the point that it is about evenly divided between Romansh-speaking and German-speaking population. Both are used as official languages in the municipality. Most of the population (as of 2000) speaks Rhaeto-Romance (55.4%), with German being second most common (42.9%) and Italian being third ( 1.8%).[15]
| Languages in Casti-Wergenstein | ||||||
| Language | Census of 1980 | Census of 1990 | Census of 2000 | |||
| Number | Percentage | Number | Percentage | Number | Percentage | |
| German | 7 | 19.44% | 14 | 32.56% | 24 | 42.86% |
| Romansh | 29 | 80.56% | 29 | 67.44% | 31 | 55.36% |
| Italian | 0 | 0.00% | 0 | 0.00% | 1 | 1.79% |
| Population | 36 | 100% | 43 | 100% | 56 | 100% |
References
- 1 2 Arealstatistik Standard - Gemeindedaten nach 4 Hauptbereichen
- 1 2 Swiss Federal Statistical Office - STAT-TAB, online database – Ständige und nichtständige Wohnbevölkerung nach institutionellen Gliederungen, Geburtsort und Staatsangehörigkeit (in German) accessed 30 August 2017
- ↑ Casti-Wergenstein in German, French and Italian in the online Historical Dictionary of Switzerland.
- ↑ Casti in German, French and Italian in the online Historical Dictionary of Switzerland.
- ↑ Wergenstein in German, French and Italian in the online Historical Dictionary of Switzerland.
- ↑ "Arealstatistik Land Use - Gemeinden nach 10 Klassen". www.landuse-stat.admin.ch. Swiss Federal Statistical Office. 24 November 2016. Retrieved 27 December 2016.
- 1 2 3 4 5 Regionalporträts 2017: Swiss Federal Statistical Office (in German) accessed 18 May 2017
- ↑ Swiss Federal Statistical Office - Amtliches Gemeindeverzeichnis der Schweiz - Mutationsmeldungen 2016 accessed 16 February 2017
- ↑ Swiss Federal Statistical Office - Ständige und nichtständige Wohnbevölkerung nach institutionellen Gliederungen, Geschlecht, Zivilstand und Geburtsort (in German) accessed 8 September 2016
- ↑ Statistical Atlas of Switzerland - Anteil Einfamilienhäuser am gesamten Gebäudebestand, 2015 accessed 18 May 2017
- ↑ Swiss Federal Statistical Office STAT-TAB - Thema 09 - Bau- und Wohnungswesen (in German) accessed 5 May 2016
- ↑ Graubunden in Numbers Archived September 24, 2009, at the Wayback Machine. (in German) accessed 21 September 2009
- ↑ Swiss Federal Statistical Office STAT-TAB Bevölkerungsentwicklung nach institutionellen Gliederungen, 1850-2000 (in German) accessed 27 April 2016
- ↑ "Nationalratswahlen 2015: Stärke der Parteien und Wahlbeteiligung nach Gemeinden" [National council elections 2015: strength of the parties and voter turnout by municipality] (in German). Swiss Federal Statistical Office. Retrieved 18 July 2016.
- 1 2 3 Swiss Federal Statistical Office Archived January 5, 2016, at the Wayback Machine. accessed 06-Oct-2009
- ↑ "Die Raumgliederungen der Schweiz 2016" (in German, French, Italian, and English). Neuchâtel, Switzerland: Swiss Federal Statistical Office. 17 February 2016. Retrieved 14 December 2016.
- ↑ Federal Statistical Office -Arbeitsstätten und Beschäftigte nach Gemeinde, Wirtschaftssektor und Grössenklasse accessed 31 October 2016
- ↑ "Arbeitslosenquote 2011". Statistical Atlas of Switzerland. Swiss Federal Statistical Office. Retrieved 4 May 2017.
- ↑ "18 - Öffentliche Finanzen > Steuern". Swiss Atlas. Swiss Federal Statistical Office. Retrieved 26 April 2017.
| Wikimedia Commons has media related to Casti-Wergenstein. |
External links
- Casti-Wergenstein in German, French and Italian in the online Historical Dictionary of Switzerland.
- Casti in German, French and Italian in the online Historical Dictionary of Switzerland.
- Wergenstein in German, French and Italian in the online Historical Dictionary of Switzerland.