Distribution of wealth
The distribution of wealth is a comparison of the wealth of various members or groups in a society. It shows one aspect of economic heterogeneity.
The distribution of wealth differs from the income distribution in that it looks at the economic distribution of ownership of the assets in a society, rather than the current income of members of that society. According to the International Association for Research in Income and Wealth, "the world distribution of wealth is much more unequal than that of income."[1]
Definition of wealth
Wealth of an individual is defined as net worth, exposed as: wealth = assets − liabilities
A broader definition of wealth, which is rarely used in the measurement of wealth inequality, also includes human capital. For example, the United Nations definition of inclusive wealth is a monetary measure which includes the sum of natural, human and physical assets.[2][3]
The relation between wealth, income, and expenses is: :change of wealth = saving = income − consumption(expenses). If an individual has a large income but also large expenses, the net effect of that income on her or his wealth could be small or even negative. The term wealth should not be confused with rich. These two terms describe different but related things. Wealth consists of those items of economic value that an individual owns, while rich is an inflow of items of economic value. (See Stock and flow.)
Conceptual framework
There are many ways in which the distribution of wealth can be analyzed. One common-used example is to compare the amount of the wealth of individual at say 99 percentile relative to the wealth of the median (or 50th) percentile. This is P99/P50, which is one of the potential Kuznets ratios. Another common measure is the ratio of total amount of wealth in the hand of top say 1% of the wealth distribution over the total wealth in the economy. In many societies, the richest ten percent control more than half of the total wealth.
Pareto Distribution has often been used to mathematically quantify the distribution of wealth at the right tail (the wealth of very rich). In fact, the tail of wealth distribution, similar to the one of income distribution, behave like Pareto distribution but with ticker tail.
Wealth over people (WOP) curves are a visually compelling way to show the distribution of wealth in a nation. WOP curves are modified distribution of wealth curves. The vertical and horizontal scales each show percentages from zero to one hundred. We imagine all the households in a nation being sorted from richest to poorest. They are then shrunk down and lined up (richest at the left) along the horizontal scale. For any particular household, its point on the curve represents how their wealth compares (as a proportion) to the average wealth of the richest percentile. For any nation, the average wealth of the richest 1/100 of households is the topmost point on the curve (people, 1%; wealth, 100%) or (p=1, w=100) or (1, 100). In the real world two points on the WOP curve are always known before any statistics are gathered. These are the topmost point (1, 100) by definition, and the rightmost point (poorest people, lowest wealth) or (p=100, w=0) or (100, 0). This unfortunate rightmost point is given because there are always at least one percent of households (incarcerated, long term illness, etc.) with no wealth at all. Given that the topmost and rightmost points are fixed … our interest lies in the form of the WOP curve between them. There are two extreme possible forms of the curve. The first is the "perfect communist" WOP. It is a straight line from the leftmost (maximum wealth) point horizontally across the people scale to p=99. Then it drops vertically to wealth = 0 at (p=100, w=0).
The other extreme is the "perfect tyranny" form. It starts on the left at the Tyrant's maximum wealth of 100%. It then immediately drops to zero at p=2, and continues at zero horizontally across the rest of the people. That is, the tyrant and his friends (the top percentile) own all the nation's wealth. All other citizens are serfs or slaves. An obvious intermediate form is a straight line connecting the left/top point to the right/bottom point. In such a "Diagonal" society a household in the richest percentile would have just twice the wealth of a family in the median (50th) percentile. Such a society is compelling to many (especially the poor). In fact it is a comparison to a diagonal society that is the basis for the Gini values used as a measure of the disequity in a particular economy. These Gini values (40.8 in 2007) show the United States to be the third most dis-equitable economy of all the developed nations (behind Denmark and Switzerland).
More sophisticated models have also been proposed.[4]
Available Data
Wealth surveys
Many countries have national wealth surveys, for example:
- The British Wealth and Assets Survey
- The Italian Survey on Household Income and Wealth
- The euro area Household Finance and Consumption Survey
- The US Survey of Consumer Finances
- The Canadian Survey of Financial Security
- The German Armuts- und Reichtumsbericht der Bundesregierung
Inequality
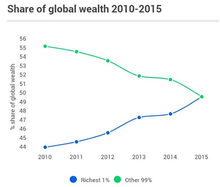
The gap between the rich and poor can be illustrated by the fact that the three wealthiest individuals in the world have assets that exceed those of the poorest 10 percent of the world's population. The net worth of the world's billionaires increased from less than $1 trillion in 2000 to over $7 trillion in 2015 so the gap is growing up dramatically.
Wealth distribution pyramid
Personal wealth varies across adults for many reasons. Some individuals with little wealth may be at early stages in their careers, with little chance or motivation to accumulate assets. Others may have suffered business setbacks or personal misfortunes, or live in parts of the world where opportunities for wealth creation are severely limited. At the other end of the spectrum, there are individuals who have acquired a large wealth through different ways. In Western countries, the most typical way of becoming wealthy is entrepreneurship (estimated three quarters of new millionaires). Other typical way (covering most of the remaining quarter) is pursuing a career with the end goal of becoming a C-level executive, a leading professional in a specific field (such as a doctor, lawyer, engineer) or a top corporate sales person. Only around 1 % of new millionaires acquire their wealth via other means such as professional sports, show business, art, inventions, investing, inheritance or lottery.
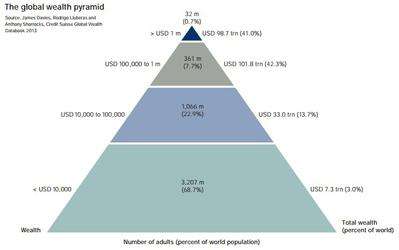
The wealth pyramid below was prepared by Credit Suisse in 2013. Personal assets were calculated in net worth, meaning wealth would be negated by having any mortgages.[7]. It has a large base of low wealth holders, alongside upper tiers occupied by progressively fewer people. In 2013 Credit-suisse estimate that 3.2 billion individuals – more than two thirds of adults in the world – have wealth below 10,000 USD. A further one billion(adult population) fall within the 10,000 – 100,000 USD range. While the average wealth holding is modest in the base and middle segments of the pyramid, their total wealth amounts to USD 40 trillion, underlining the potential for novel consumer products and innovative financial services targeted at this often neglected segment.[8]
The pyramid shows that:
- half of the world's net wealth belongs to the top 1%,
- top 10% of adults hold 85%, while the bottom 90% hold the remaining 15% of the world's total wealth,
- top 30% of adults hold 97% of the total wealth.
Wealth distribution in 2012
According to the OECD in 2012 the top 0.6% of world population (consisting of adults with more than 1 million USD in assets) or the 42 million richest people in the world held 39.3% of world wealth. The next 4.4% (311 million people) held 32.3% of world wealth. The bottom 95% held 28.4% of world wealth. The large gaps of the report get by the Gini index to 0.893, and are larger than gaps in global income inequality, measured in 2009 at 0.38.[9] For example, in 2012 the bottom 60% of the world population held same wealth in 2012 as the people on Forbes' Richest list consisting of 1,226 richest billionaires of the world.
21st century
At the end of the 20th century, wealth was concentrated among the G8 and Western industrialized nations, along with several Asian and OPEC nations.
Wealth inequality
A study by the World Institute for Development Economics Research at United Nations University reports that the richest 1% of adults alone owned 40% of global assets in the year 2000, and that the richest 10% of adults accounted for 85% of the world total. The bottom half of the world adult population owned 1% of global wealth.[10] Moreover, another study found that the richest 2% own more than half of global household assets.[11]
Real estate
While sizeable numbers of households own no land, few have no income. For example, the top 10% of land owners (all corporations) in Baltimore, Maryland own 58% of the taxable land value. The bottom 10% of those who own any land own less than 1% of the total land value.[12] This form of analysis as well as Gini coefficient analysis has been used to support land value taxation.
Credit Suisse Report – Wealth Distribution & Gini (2013)
This table was created from information provided by the Credit Suisse, Research Institute's "Global Wealth Databook", published 2013.[13]
| Country | Adults (1,000s) |
Wealth per adult (USD) |
Proportion of adults (%) by wealth range (USD) | Gini (%) | |||||
|---|---|---|---|---|---|---|---|---|---|
| Mean | Median | Under 10k | 10k – 100k | 100k – 1M | Over 1M | Total | |||
| 4,190 | 255,066 | 57,675 | 39.5 | 17 | 37.8 | 5.7 | 100 | 107.7 | |
| 110,365 | 10,976 | 871 | 93.7 | 5.6 | 0.6 | 0.1 | 100 | 93.1 | |
| 35,912 | 3,413 | 419 | 97.4 | 2.3 | 0.2 | 0 | 100 | 90 | |
| 10,958 | 7,161 | 1,176 | 93.1 | 6.3 | 0.6 | 0.1 | 100 | 86.7 | |
| 2,953 | 30,868 | 6,076 | 66.8 | 29.8 | 3.2 | 0.3 | 100 | 86.3 | |
| 239,279 | 301,140 | 44,911 | 30.7 | 33 | 30.7 | 5.5 | 100 | 85.1 | |
| 6,690 | 2,913 | 479 | 93.9 | 5.8 | 0.3 | 0 | 100 | 83.8 | |
| 51,687 | 25,909 | 5,326 | 67 | 30.3 | 2.5 | 0.2 | 100 | 83.7 | |
| 31,034 | 19,613 | 3,051 | 72.3 | 24.9 | 2.6 | 0.1 | 100 | 83.6 | |
| 6,052 | 153,312 | 32,384 | 30.3 | 49.7 | 18.3 | 1.7 | 100 | 83.1 | |
| 56,730 | 8,799 | 1,849 | 88.1 | 11.1 | 0.8 | 0.1 | 100 | 82.9 | |
| 157,869 | 11,839 | 2,393 | 81.1 | 17.6 | 1.3 | 0.1 | 100 | 82.8 | |
| 49,642 | 7,772 | 1,855 | 90.5 | 8.8 | 0.6 | 0 | 100 | 82.6 | |
| 18,991 | 6,900 | 1,505 | 90.9 | 8.5 | 0.6 | 0 | 100 | 82.5 | |
| 135,385 | 23,278 | 5,117 | 66.6 | 30.5 | 2.7 | 0.2 | 100 | 82.1 | |
| 18,382 | 27,007 | 5,831 | 61.4 | 35.3 | 3.1 | 0.2 | 100 | 81.5 | |
| 12,461 | 49,032 | 11,742 | 45 | 48 | 6.6 | 0.4 | 100 | 81.4 | |
| 767,612 | 76,092 | 1,040 | 94.4 | 5.2 | 0.3 | 0 | 100 | 81.3 | |
| 6,101 | 512,562 | 95,916 | 5.2 | 46 | 38.8 | 10 | 100 | 80.6 | |
| 7,299 | 299,441 | 52,677 | 15.6 | 48.3 | 29.2 | 6.9 | 100 | 80.3 | |
| 52,710 | 7,285 | 1,852 | 90.4 | 9 | 0.6 | 0 | 100 | 80.3 | |
| 80,462 | 3,620 | 894 | 94.9 | 4.9 | 0.3 | 0 | 100 | 80 | |
| 30,464 | 26,222 | 6,228 | 60.2 | 35.8 | 3.9 | 0.2 | 100 | 79.7 | |
| 54 | 60,003 | 14,617 | 40 | 50 | 9.2 | 0.8 | 100 | 79.6 | |
| 28,265 | 15,638 | 4,032 | 72.1 | 26.1 | 1.7 | 0.1 | 100 | 79.6 | |
| 16,694 | 37,346 | 9,772 | 53.3 | 41.1 | 5.3 | 0.3 | 100 | 79.3 | |
| 1,256 | 19,899 | 4,531 | 67.5 | 28.3 | 4.2 | 0.1 | 100 | 78.7 | |
| 4,947 | 137,351 | 38,164 | 30 | 44.8 | 23.7 | 1.5 | 100 | 78.7 | |
| 388 | 2,872 | 670 | 93.8 | 6.1 | 0.2 | 0 | 100 | 78.7 | |
| 694 | 119,568 | 34,874 | 23.8 | 56.3 | 18.6 | 1.4 | 100 | 78.3 | |
| 73,380 | 35,872 | 9,718 | 53.5 | 40.6 | 5.7 | 0.3 | 100 | 78 | |
| 3,733 | 380,473 | 92,859 | 19.4 | 32.5 | 40.6 | 7.5 | 100 | 77.8 | |
| 6,761 | 203,931 | 57,450 | 28.2 | 31.8 | 37 | 3 | 100 | 77.8 | |
| 4,291 | 28,397 | 6,563 | 58.1 | 35.7 | 6 | 0.1 | 100 | 77.7 | |
| 1,181 | 10,348 | 2,649 | 81 | 17.6 | 1.4 | 0 | 100 | 77.2 | |
| 67,068 | 192,232 | 49,370 | 29 | 33.3 | 35.1 | 2.6 | 100 | 77.1 | |
| 5,813 | 3,532 | 960 | 92.3 | 7.5 | 0.2 | 0 | 100 | 76.1 | |
| 9,273 | 14,708 | 3,934 | 69.1 | 28.8 | 2.1 | 0 | 100 | 75.6 | |
| 2,370 | 800 | 241 | 99.1 | 0.9 | 0 | 0 | 100 | 74.8 | |
| 5,800 | 4,604 | 1,368 | 89.3 | 10.4 | 0.3 | 0 | 100 | 74.4 | |
| 6,151 | 1,817 | 548 | 96.8 | 3.2 | 0 | 0 | 100 | 74.1 | |
| 8,437 | 44,975 | 15,541 | 40 | 53.2 | 6.4 | 0.3 | 100 | 74 | |
| 3,955 | 281,764 | 90,466 | 20 | 34.2 | 41.4 | 4.4 | 100 | 73.9 | |
| 2,291 | 119,101 | 42,897 | 21.8 | 55.5 | 21.5 | 1.2 | 100 | 73.8 | |
| 30,255 | 26,056 | 9,109 | 55 | 41.5 | 3.3 | 0.1 | 100 | 73.7 | |
| 18,359 | 151,752 | 53,336 | 22.5 | 45.1 | 30.8 | 1.7 | 100 | 73.6 | |
| 12,914 | 185,588 | 83,631 | 23.3 | 30.9 | 43.6 | 2.2 | 100 | 73.2 | |
| 188 | 9,998 | 3,130 | 76.3 | 22.6 | 1.1 | 0 | 100 | 73.1 | |
| 344 | 14,250 | 4,544 | 68.8 | 29.6 | 1.6 | 0 | 100 | 73 | |
| 3,424 | 3,432 | 1,147 | 92.5 | 7.3 | 0.1 | 0 | 100 | 73 | |
| 16,692 | 14,044 | 5,137 | 69.3 | 29.2 | 1.4 | 0.1 | 100 | 73 | |
| 1,079 | 3,457 | 1,105 | 92.4 | 7.5 | 0.1 | 0 | 100 | 72.9 | |
| 3,910 | 10,934 | 3,726 | 73.2 | 25.6 | 1.3 | 0 | 100 | 72.8 | |
| 628 | 4,360 | 1,393 | 90 | 9.8 | 0.2 | 0 | 100 | 72.7 | |
| 2,322 | 22,292 | 7,509 | 57.3 | 38.5 | 4.2 | 0 | 100 | 72.7 | |
| 5,306 | 723 | 245 | 99.3 | 0.7 | 0 | 0 | 100 | 72.7 | |
| 86 | 2,721 | 959 | 94.3 | 5.7 | 0.1 | 0 | 100 | 72.7 | |
| 27,173 | 251,034 | 90,252 | 30 | 21.5 | 44.9 | 3.7 | 100 | 72.7 | |
| 38,350 | 79,475 | 30,938 | 25.3 | 59.5 | 14.5 | 0.7 | 100 | 72.6 | |
| 3,752 | 8,470 | 2,821 | 81.1 | 18 | 0.8 | 0 | 100 | 72.4 | |
| 295 | 16,313 | 5,478 | 65 | 32.5 | 2.5 | 0 | 100 | 72.3 | |
| 63 | 19,011 | 6,281 | 58.8 | 38.3 | 3 | 0 | 100 | 72.2 | |
| 3,246 | 28,124 | 9,532 | 54.1 | 40.2 | 5.7 | 0.1 | 100 | 72.2 | |
| 50 | 24,086 | 8,349 | 55 | 40.3 | 4.7 | 0.1 | 100 | 72 | |
| 34 | 23,613 | 8,185 | 56.3 | 39.1 | 4.6 | 0.1 | 100 | 71.9 | |
| 71 | 10,196 | 3,492 | 73.8 | 25.1 | 1.1 | 0 | 100 | 71.9 | |
| 67 | 14,473 | 5,017 | 67.5 | 30.7 | 1.7 | 0 | 100 | 71.9 | |
| 3,234 | 182,548 | 76,607 | 25.6 | 34.1 | 38.1 | 2.3 | 100 | 71.8 | |
| 8,723 | 12,350 | 4,403 | 69.8 | 28.8 | 1.4 | 0 | 100 | 71.4 | |
| 3,738 | 12,039 | 4,483 | 70 | 28.7 | 1.3 | 0 | 100 | 71 | |
| 3,488 | 183,804 | 75,573 | 20.9 | 36.5 | 40.4 | 2.2 | 100 | 70.9 | |
| 20,757 | 2,843 | 1,049 | 94.2 | 5.7 | 0.1 | 0 | 100 | 70.9 | |
| 1,872 | 48,415 | 18,152 | 40 | 47.8 | 12 | 0.2 | 100 | 70.8 | |
| 18,865 | 18,227 | 6,705 | 58.5 | 38.9 | 2.6 | 0 | 100 | 70.8 | |
| 908 | 864 | 324 | 99.2 | 0.8 | 0 | 0 | 100 | 70.8 | |
| 2,024 | 3,892 | 1,420 | 91.2 | 8.6 | 0.1 | 0 | 100 | 70.8 | |
| 3,777 | 126,791 | 51,882 | 20 | 50.6 | 28.2 | 1.3 | 100 | 70.5 | |
| 1,278 | 153,294 | 58,237 | 25 | 38.3 | 35 | 1.7 | 100 | 70.5 | |
| 8,614 | 89,074 | 38,846 | 25.8 | 54.8 | 18.7 | 0.8 | 100 | 70.1 | |
| 11,441 | 811 | 313 | 99.3 | 0.7 | 0 | 0 | 100 | 70 | |
| 1,719 | 11,401 | 4,393 | 70 | 28.8 | 1.2 | 0 | 100 | 69.9 | |
| 2,400 | 47,002 | 17,998 | 39.6 | 48.3 | 11.9 | 0.2 | 100 | 69.8 | |
| 15,107 | 750 | 294 | 99.4 | 0.6 | 0 | 0 | 100 | 69.6 | |
| 31,854 | 321 | 124 | 99.9 | 0.1 | 0 | 0 | 100 | 69.6 | |
| 998,254 | 22,230 | 8,023 | 58.4 | 39.1 | 2.4 | 0.1 | 100 | 69.5 | |
| 10,359 | 448 | 177 | 99.8 | 0.2 | 0 | 0 | 100 | 69.4 | |
| 474 | 3,801 | 1,506 | 91.6 | 8.3 | 0.1 | 0 | 100 | 69.2 | |
| 523 | 6,473 | 2,630 | 85 | 14.6 | 0.4 | 0 | 100 | 69 | |
| 48,124 | 295,933 | 141,850 | 21.7 | 22.9 | 50.8 | 4.6 | 100 | 69 | |
| 200 | 22,289 | 8,108 | 55 | 41.5 | 3.5 | 0 | 100 | 69 | |
| 2,781 | 2,125 | 875 | 96.3 | 3.7 | 0 | 0 | 100 | 68.9 | |
| 1,561 | 11,543 | 4,743 | 69.3 | 29.6 | 1.1 | 0 | 100 | 68.8 | |
| 2,897 | 681 | 273 | 99.6 | 0.4 | 0 | 0 | 100 | 68.8 | |
| 13,501 | 1,811 | 743 | 97.7 | 2.3 | 0 | 0 | 100 | 68.6 | |
| 119 | 13,087 | 5,296 | 66.3 | 32.5 | 1.2 | 0 | 100 | 68.5 | |
| 7,452 | 21,084 | 8,823 | 55 | 41.5 | 3.5 | 0 | 100 | 68.2 | |
| 869 | 21,860 | 9,240 | 55 | 41.3 | 3.7 | 0 | 100 | 68.2 | |
| 298 | 9,868 | 4,261 | 73.8 | 25.3 | 1 | 0 | 100 | 68.1 | |
| 21,355 | 11,398 | 4,750 | 70 | 28.9 | 1.1 | 0 | 100 | 68.1 | |
| 11,501 | 2,640 | 1,104 | 95 | 4.9 | 0.1 | 0 | 100 | 68.1 | |
| 14,326 | 5,033 | 2,101 | 87.9 | 11.9 | 0.2 | 0 | 100 | 68 | |
| 3,352 | 36,570 | 15,305 | 40 | 52.1 | 7.8 | 0.1 | 100 | 68 | |
| 3,172 | 21,640 | 9,178 | 54.7 | 41.8 | 3.5 | 0 | 100 | 68 | |
| 3,693 | 2,450 | 1,049 | 95.6 | 4.3 | 0 | 0 | 100 | 67.9 | |
| 48,220 | 243,570 | 111,524 | 18 | 28.8 | 50 | 3.2 | 100 | 67.7 | |
| 1,832 | 1,967 | 865 | 97 | 3 | 0 | 0 | 100 | 67.7 | |
| 7,721 | 1,273 | 543 | 98.7 | 1.3 | 0 | 0 | 100 | 67.7 | |
| 508 | 3,465 | 1,488 | 92.8 | 7.2 | 0.1 | 0 | 100 | 67.5 | |
| 5,485 | 1,131 | 483 | 99 | 1 | 0 | 0 | 100 | 67.5 | |
| 987 | 15,088 | 6,459 | 60 | 38.5 | 1.5 | 0 | 100 | 67.4 | |
| 7,417 | 207 | 89 | 100 | 0 | 0 | 0 | 100 | 67.3 | |
| 5,301 | 882 | 380 | 99.4 | 0.6 | 0 | 0 | 100 | 67.3 | |
| 253 | 211,592 | 104,733 | 20 | 30 | 47.3 | 2.7 | 100 | 67.3 | |
| 54 | 15,905 | 7,217 | 58.8 | 39.8 | 1.5 | 0 | 100 | 67.2 | |
| 6,423 | 2,597 | 1,125 | 95.3 | 4.7 | 0 | 0 | 100 | 67.2 | |
| 10,459 | 2,603 | 1,115 | 95.2 | 4.8 | 0 | 0 | 100 | 67.2 | |
| 138 | 6,068 | 2,753 | 85 | 14.7 | 0.3 | 0 | 100 | 67.1 | |
| 4,733 | 3,187 | 1,398 | 93.6 | 6.3 | 0.1 | 0 | 100 | 67.1 | |
| 92 | 34,537 | 15,132 | 40 | 53 | 6.9 | 0.1 | 100 | 67 | |
| 9,151 | 2,644 | 1,155 | 95 | 4.9 | 0 | 0 | 100 | 67 | |
| 12,192 | 4,951 | 2,193 | 88.3 | 11.6 | 0.2 | 0 | 100 | 66.8 | |
| 53,270 | 8,727 | 3,846 | 75 | 24.4 | 0.6 | 0 | 100 | 66.8 | |
| 2,118 | 2,173 | 987 | 96.5 | 3.5 | 0 | 0 | 100 | 66.7 | |
| 22,038 | 951 | 423 | 99.3 | 0.7 | 0 | 0 | 100 | 66.6 | |
| 3,618 | 5,393 | 2,411 | 86.7 | 13.1 | 0.2 | 0 | 100 | 66.5 | |
| 2,537 | 23,411 | 10,635 | 47.5 | 48.5 | 3.9 | 0 | 100 | 66.5 | |
| 34,180 | 2,214 | 941 | 97 | 3 | 0 | 0 | 100 | 66.4 | |
| 4,195 | 171,821 | 95,095 | 29 | 22.3 | 47.2 | 1.6 | 100 | 66.4 | |
| 210 | 5,556 | 2,480 | 85 | 14.8 | 0.2 | 0 | 100 | 66.3 | |
| 242 | 41,106 | 17,842 | 35 | 55.9 | 9 | 0.1 | 100 | 66.2 | |
| 37,206 | 123,997 | 63,306 | 17.4 | 52.4 | 29 | 1.1 | 100 | 66.1 | |
| 1,855 | 14,214 | 6,433 | 61.1 | 37.6 | 1.3 | 0 | 100 | 66.1 | |
| 13,352 | 7,073 | 3,198 | 82.7 | 16.9 | 0.4 | 0 | 100 | 66 | |
| 1,787 | 24,285 | 11,338 | 45 | 50.9 | 4 | 0 | 100 | 66 | |
| 9,105 | 102,971 | 53,937 | 20.4 | 53.7 | 25.1 | 0.8 | 100 | 65.9 | |
| 3,858 | 14,364 | 6,589 | 60.3 | 38.3 | 1.4 | 0 | 100 | 65.9 | |
| 3,568 | 5,385 | 2,432 | 85.9 | 13.9 | 0.2 | 0 | 100 | 65.9 | |
| 61,765 | 4,857 | 2,215 | 87.8 | 12 | 0.2 | 0 | 100 | 65.8 | |
| 1,739 | 8,979 | 4,200 | 73.1 | 26.3 | 0.6 | 0 | 100 | 65.8 | |
| 365 | 19,525 | 9,130 | 55 | 42.6 | 2.4 | 0 | 100 | 65.8 | |
| 2,985 | 11,173 | 5,139 | 68.2 | 30.9 | 0.9 | 0 | 100 | 65.8 | |
| 390 | 315,240 | 182,768 | 15 | 22.5 | 57 | 5.5 | 100 | 65.7 | |
| 1,055 | 33,701 | 15,724 | 40 | 53.3 | 6.6 | 0.1 | 100 | 65.7 | |
| 836 | 424 | 199 | 99.9 | 0.1 | 0 | 0 | 100 | 65.7 | |
| 2,237 | 9,450 | 4,451 | 72.7 | 26.6 | 0.7 | 0 | 100 | 65.6 | |
| 7,014 | 937 | 434 | 99.3 | 0.7 | 0 | 0 | 100 | 65.5 | |
| 23,982 | 10,100 | 4,673 | 70 | 29.2 | 0.7 | 0 | 100 | 65.5 | |
| 23,811 | 1,291 | 595 | 98.9 | 1.1 | 0 | 0 | 100 | 65.4 | |
| 4,729 | 293 | 137 | 99.9 | 0.1 | 0 | 0 | 100 | 65.2 | |
| 6,276 | 16,344 | 7,721 | 57.1 | 41.4 | 1.5 | 0 | 100 | 65.1 | |
| 3,498 | 26,551 | 12,639 | 41.2 | 54.1 | 4.7 | 0 | 100 | 65.1 | |
| 49,117 | 241,383 | 138,653 | 20 | 20.5 | 56.5 | 3 | 100 | 65 | |
| 6,464 | 955 | 455 | 99.4 | 0.6 | 0 | 0 | 100 | 64.7 | |
| 2,692 | 3,854 | 1,874 | 91.8 | 8.1 | 0.1 | 0 | 100 | 64.7 | |
| 17,273 | 1,998 | 951 | 97.7 | 2.3 | 0 | 0 | 100 | 64.7 | |
| 104,135 | 1,894 | 908 | 97.9 | 2.1 | 0 | 0 | 100 | 64.6 | |
| 935 | 37,308 | 19,247 | 40 | 52.5 | 7.4 | 0.1 | 100 | 64.5 | |
| 7,915 | 28,379 | 14,068 | 40 | 55 | 4.9 | 0 | 100 | 64 | |
| 2,263 | 5,613 | 2,793 | 85.5 | 14.3 | 0.2 | 0 | 100 | 63.9 | |
| 4,022 | 3,168 | 1,581 | 94.3 | 5.7 | 0.1 | 0 | 100 | 63.8 | |
| 106,365 | 4,248 | 2,106 | 90.8 | 9 | 0.1 | 0 | 100 | 63.8 | |
| 42,750 | 411 | 207 | 99.9 | 0.1 | 0 | 0 | 100 | 63.6 | |
| 16,617 | 402,578 | 219,505 | 6.9 | 23.7 | 62.6 | 6.8 | 100 | 63.6 | |
| 104,315 | 216,694 | 110,294 | 9.2 | 37.7 | 50.6 | 2.5 | 100 | 63.5 | |
| 467 | 21,340 | 10,929 | 45 | 52.6 | 2.4 | 0 | 100 | 63.4 | |
| 8,387 | 255,573 | 148,141 | 17.4 | 22.1 | 57.3 | 3.2 | 100 | 62.6 | |
| 7,527 | 15,175 | 7,978 | 56.8 | 42 | 1.3 | 0 | 100 | 62.5 | |
| 5,991 | 16,818 | 8,825 | 55.2 | 43.4 | 1.4 | 0 | 100 | 62.5 | |
| 7,543 | 2,407 | 1,271 | 96.8 | 3.1 | 0 | 0 | 100 | 62.2 | |
| 330 | 71,448 | 42,898 | 18.8 | 65 | 15.9 | 0.3 | 100 | 59.5 | |
| 571 | 44,822 | 26,675 | 28.7 | 60 | 11.2 | 0 | 100 | 58.5 | |
| 286 | 51,373 | 31,527 | 26.2 | 58.7 | 15 | 0 | 100 | 58.5 | |
| 1,655 | 64,067 | 44,932 | 19.4 | 60.6 | 19.9 | 0.1 | 100 | 53.5 | |
| 4,303 | 27,224 | 20,740 | 19.8 | 77.8 | 2.4 | 0 | 100 | 44.7 | |
In the United States
Distribution of net worth in the United States (2007). The net wealth of many people in the lowest 20% is negative because of debt.[14]
According to PolitiFact, in 2011 the 400 wealthiest Americans "have more wealth than half of all Americans combined."[15][16][17][18] Inherited wealth may help explain why many Americans who have become rich may have had a "substantial head start".[19][20] In September 2012, according to the Institute for Policy Studies, "over 60 percent" of the Forbes richest 400 Americans "grew up in substantial privilege".[21]
In 2007, the richest 1% of the American population owned 34.6% of the country's total wealth (excluding human capital), and the next 19% owned 50.5%. The top 20% of Americans owned 85% of the country's wealth and the bottom 80% of the population owned 15%. From 1922 to 2010, the share of the top 1% varied from 19.7% to 44.2%, the big drop being associated with the drop in the stock market in the late 1970s. Ignoring the period where the stock market was depressed (1976–1980) and the period when the stock market was overvalued (1929), the share of wealth of the richest 1% remained extremely stable, at about a third of the total wealth.[22] Financial inequality was greater than inequality in total wealth, with the top 1% of the population owning 42.7%, the next 19% of Americans owning 50.3%, and the bottom 80% owning 7%.[23] However, after the Great Recession which started in 2007, the share of total wealth owned by the top 1% of the population grew from 34.6% to 37.1%, and that owned by the top 20% of Americans grew from 85% to 87.7%. The Great Recession also caused a drop of 36.1% in median household wealth but a drop of only 11.1% for the top 1%, further widening the gap between the 1% and the 99%.[14][22][23] During the economic expansion between 2002 and 2007, the income of the top 1% grew 10 times faster than the income of the bottom 90%. In this period 66% of total income gains went to the 1%, who in 2007 had a larger share of total income than at any time since 1928.
Dan Ariely and Michael Norton show in a study (2011) that US citizens across the political spectrum significantly underestimate the current US wealth inequality and would prefer a more egalitarian distribution of wealth, raising questions about ideological disputes over issues like taxation and welfare.[24]
| Year | Bottom 99% |
Top 1% |
|---|---|---|
| 1922 | 63.3% | 36.7% |
| 1929 | 55.8% | 44.2% |
| 1933 | 66.7% | 33.3% |
| 1939 | 63.6% | 36.4% |
| 1945 | 70.2% | 29.8% |
| 1949 | 72.9% | 27.1% |
| 1953 | 68.8% | 31.2% |
| 1962 | 68.2% | 31.8% |
| 1965 | 65.6% | 34.4% |
| 1969 | 68.9% | 31.1% |
| 1972 | 70.9% | 29.1% |
| 1976 | 80.1% | 19.9% |
| 1979 | 79.5% | 20.5% |
| 1981 | 75.2% | 24.8% |
| 1983 | 69.1% | 30.9% |
| 1986 | 68.1% | 31.9% |
| 1989 | 64.3% | 35.7% |
| 1992 | 62.8% | 37.2% |
| 1995 | 61.5% | 38.5% |
| 1998 | 61.9% | 38.1% |
| 2001 | 66.6% | 33.4% |
| 2004 | 65.7% | 34.3% |
| 2007 | 65.4% | 34.6% |
| 2010 | 64.6% | 35.4% |
Additional data, charts, and graphs
- Wealth, Income, and Power by G. William Domhoff
- PowerPoint presentation: Inequalities of Development – Lorenz curve and Gini coefficient]
- The World Distribution of Household Wealth [10]
- Article on The World Distribution of Household Wealth report.
- The Federal Reserve Board – Survey of Consumer Finances
- Survey of Consumer Finances 1998–2004 charts – pdf
- Survey of Consumer Finances 1998–2004 data
and resulting Gini indices for mean incomes: 1989: 51.1, 1992: 47.8, 1995: 49.0, 1998: 50.4, 2001: 52.6, 2004: 51.4 - Changes in the Distribution of Wealth in the U.S., 1989–2001
- Report on Net Worth and Asset Ownership of Households
- Projections of the Number of Households in the U.S. 1995–2010
- The System of National Accounts (SNA): comparison of U.S. national accounts statistics with those of other countries
- World Trade Organization: Resources
- Champagne Glass infographic of global wealth distribution from Dalton Conley's You May Ask Yourself: An Introduction to Thinking Like a Sociologist textbook which was adapted from the 1992 UNDP original
World distribution of wealth
 world distribution of wealth by country (PPP)
 world distribution of wealth by region (PPP)
 world distribution of wealth by country (exchange rates)
 world distribution of wealth by region (exchange rates)
By region
| Region | Proportion of world… (%)[22][26] | ||||
|---|---|---|---|---|---|
| Population | Net worth… | GDP… | |||
| PPP | Exchange rates | PPP | Exchange rates | ||
| North America | 5.2 | 27.1 | 34.4 | 23.9 | 33.7 |
| Central/South America | 8.5 | 6.5 | 4.3 | 8.5 | 6.4 |
| Europe | 9.6 | 26.4 | 29.2 | 22.8 | 32.4 |
| Africa | 10.7 | 1.5 | 0.5 | 2.4 | 1.0 |
| Middle East | 9.9 | 5.1 | 3.1 | 5.7 | 4.1 |
| Asia | 52.2 | 29.4 | 25.6 | 31.1 | 24.1 |
| Other | 3.2 | 3.7 | 2.6 | 5.4 | 3.4 |
| Totals (rounded) | 100% | 100% | 100% | 100% | 100% |
World distribution of financial wealth In 2007, 147 companies controlled nearly 40 percent of the monetary value of all transnational corporations.[27]
Wealth concentration
Wealth concentration is a process by which created wealth, under some conditions, can become concentrated by individuals or entities. Those who hold wealth have the means to invest in newly created sources and structures of wealth, or to otherwise leverage the accumulation of wealth, and are thus the beneficiaries of even greater wealth.
Economic conditions
The first necessary condition for the phenomenon of wealth concentration to occur is an unequal initial distribution of wealth. The distribution of wealth throughout the population is often closely approximated by a Pareto distribution, with tails which decay as a power-law in wealth. (See also: Distribution of wealth and Economic inequality). According to PolitiFact and others, the 400 wealthiest Americans had "more wealth than half of all Americans combined."[15][16][17][18] Inherited wealth may help explain why many Americans who have become rich may have had a "substantial head start".[19][20] In September 2012, according to the Institute for Policy Studies, "over 60 percent" of the Forbes richest 400 Americans "grew up in substantial privilege".[21]
The second condition is that a small initial inequality must, over time, widen into a larger inequality. This is an example of positive feedback in an economic system. A team from Jagiellonian University produced statistical model economies showing that wealth condensation can occur whether or not total wealth is growing (if it is not, this implies that the poor could become poorer).[28]
Correlation between being rich and earning more
Given an initial condition in which wealth is unevenly distributed (i.e., a "wealth gap"[29]), several non-exclusive economic mechanisms for wealth condensation have been proposed:
- A correlation between being rich and being given high paid employment (oligarchy).
- A marginal propensity to consume low enough that high incomes are correlated with people who have already made themselves rich (meritocracy).
- The ability of the rich to influence government disproportionately to their favor thereby increasing their wealth (plutocracy).[30]
In the first case, being wealthy gives one the opportunity to earn more through high paid employment (e.g., by going to elite schools). In the second case, having high paid employment gives one the opportunity to become rich (by saving your money). In the case of plutocracy, the wealthy exert power over the legislative process, which enables them to increase the wealth disparity.[31] An example of this is the high cost of political campaigning in some countries, in particular in the US (more generally, see also plutocratic finance).
Because these mechanisms are non-exclusive, it is possible for all three explanations to work together for a compounding effect, increasing wealth concentration even further. Obstacles to restoring wage growth might have more to do with the broader dysfunction of a dollar dominated system particular to the US than with the role of the extremely wealthy.[32]
Counterbalances to wealth concentration include certain forms of taxation, in particular wealth tax, inheritance tax and progressive taxation of income. However, concentrated wealth does not necessarily inhibit wage growth for ordinary workers.[33]
Markets with social influence
Product recommendations and information about past purchases have been shown to influence consumers choices significantly whether it is for music, movie, book, technological, and other type of products. Social influence often induces a rich-get-richer phenomenon (Matthew effect) where popular products tend to become even more popular.[34]
Redistribution of wealth and public policy
In many societies, attempts have been made, through property redistribution, taxation, or regulation, to redistribute wealth, sometimes in support of the upper class, and sometimes to diminish economic inequality.
Examples of this practice go back at least to the Roman republic in the third century B.C.,[35] when laws were passed limiting the amount of wealth or land that could be owned by any one family. Motivations for such limitations on wealth include the desire for equality of opportunity, a fear that great wealth leads to political corruption, to the belief that limiting wealth will gain the political favor of a voting bloc, or fear that extreme concentration of wealth results in rebellion.[36] Various forms of socialism attempt to diminish the unequal distribution of wealth and thus the conflicts and social problems (see image below) arising from it.[37]
During the Age of Reason, Francis Bacon wrote "Above all things good policy is to be used so that the treasures and monies in a state be not gathered into a few hands… Money is like fertilizer, not good except it be spread."[38]
Communism arose as a reaction to a distribution of wealth in which a few lived in luxury while the masses lived in extreme poverty. In the Critique of the Gotha Program, Marx and Engels wrote "From each according to his ability, to each according to his need." While the ideas of Marx have nominally been embraced by various states (Russia, Cuba, Vietnam and China in the 20th century), Marxist utopia remains elusive.[39]
On the other hand, the combination of labor movements, technology, and social liberalism has diminished extreme poverty in the developed world today, though extremes of wealth and poverty continue in the Third World.[40]
In the Outlook on the Global Agenda 2014 from the World Economic Forum the widening income disparities come second as a worldwide risk.[41][42]
See also
References
- ↑ James B. Davies; Susanna Sandström; Anthony F. Shorrocks; Edward N. Wolff. "Estimating the World Distribution of Household Wealth" (PDF). Institution/Country: University of Western Ontario, Canada; WIDER-UNU. Retrieved 2016-09-10.
- ↑ Sponsored by (2012-06-30). "Free exchange: The real wealth of nations". The Economist. Retrieved 2012-07-14.
- ↑ "Inclusive Wealth Report – IHDP". Ihdp.unu.edu. 2012-07-09. Retrieved 2012-07-14.
- ↑ "Why it is hard to share the wealth". New Scientist. 2005-03-12. Retrieved 2012-03-26.
- ↑ "62 people own same as half world – Oxfam | Press releases | Oxfam GB". Oxfam.org.uk. 2016-01-18. Retrieved 2016-09-10.
- ↑ "Yes, Oxfam, the Richest 1% Have Most of the Wealth. But That Means Less Than You Think". Time.
- ↑ "Yes, Oxfam, the Richest 1% Have Most of the Wealth. But That Means Less Than You Think". Time.
- 1 2 "Global Wealth Report 2013". credit-suisse.com.
- ↑ "The World Factbook – Central Intelligence Agency". Cia.gov. Retrieved 2016-09-10.
- 1 2 The World Distribution of Household Wealth. James B. Davies, Susanna Sandstrom, Anthony Shorrocks, and Edward N. Wolff. 5 December 2006.
- Launch of the WIDER study on The World Distribution of Household Wealth (includes press release, summary, and data)
- Estimating the Level and Distribution of Global Household Wealth (copy of full report with a cover page added)
- The World Distribution of Household Wealth (exact copy of report published at United Nations website)
- ↑ The rich really do own the world 5 December 2006
- ↑ Kromkowski, "Who owns Baltimore", CSE/HGFA, 2007.
- ↑ Source Credit Suisse, Research Institute – Global Wealth Databook 2013
- 1 2 Working Paper No. 589 Recent Trends in Household Wealth in the United States: Rising Debt and the Middle-Class Squeeze – an Update to 2007 by Edward N. Wolff, Levy Economics Institute of Bard College, March 2010
- 1 2 Kertscher, Tom; Borowski, Greg (March 10, 2011). "The Truth-O-Meter Says: True – Michael Moore says 400 Americans have more wealth than half of all Americans combined". PolitiFact. Retrieved August 11, 2013.
- 1 2 Moore, Michael (March 6, 2011). "America Is Not Broke". Huffington Post. Retrieved August 11, 2013.
- 1 2 Moore, Michael (March 7, 2011). "The Forbes 400 vs. Everybody Else". michaelmoore.com. Archived from the original on 2011-03-09. Retrieved August 11, 2013.
- 1 2 Pepitone, Julianne (September 22, 2010). "Forbes 400: The super-rich get richer". CNN. Retrieved August 11, 2013.
- 1 2 Bruenig, Matt (March 24, 2014). "You call this a meritocracy? How rich inheritance is poisoning the American economy". Salon. Retrieved August 24, 2014.
- 1 2 Staff (March 18, 2014). "Inequality – Inherited wealth". The Economist. Retrieved August 24, 2014.
- 1 2 Pizzigati, Sam (September 24, 2012). "The 'Self-Made' Hallucination of America's Rich". Institute for Policy Studies. Retrieved August 24, 2014.
- 1 2 3 4 Wealth, Income, and Power by G. William Domhoff of the UC-Santa Barbara Sociology Department
- 1 2 Occupy Wall Street And The Rhetoric of Equality Forbes November 1, 2011 by Deborah L. Jacobs
- ↑ Norton, M. I., & Ariely, D., "Building a Better America – One Wealth Quintile at a Time", Perspectives on Psychological Science, January 2011 6: 9-12
- ↑ 1922–1989 data from Wolff (1996), 1992–2010 data from Wolff (2012)
- ↑ Data for the following table obtained from UNU-WIDER World Distribution of Household Wealth Report (The University of California also hosts a copy of the report)
- ↑ Financial world dominated by a few deep pockets. By Rachel Ehrenberg. September 24, 2011; Vol.180 #7 (p. 13). Science News. Citation is in the right sidebar. Paper is here with PDF here .
- ↑ Burdaa, Z.; et al. (January 22, 2001). "Wealth Condensation in Pareto Macro-Economies" (PDF). Physical Review E. 65 (2). arXiv:cond-mat/0101068. Bibcode:2002PhRvE..65b6102B. doi:10.1103/PhysRevE.65.026102. Retrieved September 11, 2013.
- ↑ Rugaber, Christopher S.; Boak, Josh (January 27, 2014). "Wealth gap: A guide to what it is, why it matters". AP News. Retrieved January 27, 2014.
- ↑ Ravi Batra. The New Golden Age: The Coming Revolution against Political Corruption and Economic Chaos. Palgrave Macmillan, 2007,
ISBN 1-4039-7579-5. templatestyles stripmarker in
|publisher=at position 27 (help) - ↑ Harold Hudson Channer (25 July 2011). "TV interview with Dr. Ravi Batra". Retrieved 21 October 2011.
- ↑ Bessen, James (2015). Learning by Doing: The Real Connection between Innovation, Wages, and Wealth. Yale University Press. pp. 226–27. ISBN 978-0300195668.
The obstacles to restoring wage growth might have more to do with the broader dysfunction of our dollar- dominated political system than with the particular role of the extremely wealthy.
- ↑ Bessen, James (2015). Learning by Doing: The Real Connection between Innovation, Wages, and Wealth. Yale University Press. p. 3. ISBN 978-0300195668.
However, concentrated wealth does not necessarily inhibit wage growth.
- ↑ Altszyler, E; Berbeglia, F.; Berbeglia, G.; Van Hentenryck, P. (2017). "Transient dynamics in trial-offer markets with social influence: Trade-offs between appeal and quality". PLoS ONE. 12 (7): e0180040. Bibcode:2017PLoSO..1280040A. doi:10.1371/journal.pone.0180040.
- ↑ Livy, Rome and Italy: Books VI-X of the History of Rome from its Foundation, Penguin Classics, ISBN 0-14-044388-6
- ↑ "… A perceived sense of inequity is a common ingredient of rebellion in societies …", Amartya Sen, 1973
- ↑ "The Spirit Level" by Richard Wilkinson and Kate Pickett;Bloomsbury Press 2009
- ↑ Francis Bacon, Of Seditions and Troubles
- ↑ Archie Brown, The Rise and Fall of Communism, Ecco, 2009, ISBN 978-0-06-113879-9
- ↑ Jeffrey D. Sachs, The End of Poverty, Penguin, 2006, ISBN 978-0-14-303658-6
- ↑ "Outlook on the Global Agenda 2014 – Reports". Reports.weforum.org. World Economic Forum. Retrieved 2016-09-10.
- ↑ "178 Oxfam Briefing Paoer" (PDF). Oxfam.org. 20 January 2014. Retrieved 2016-09-10.
External links
- U.N. statistics – Distribution of Income and Consumption; wealth and poverty
- Research on the World Distribution of Household Wealth (UNU-WIDER)
- CIA World Factbook: Field Listing – Distribution of family income – Gini index
- Annual income of richest 100 people enough to end global poverty four times over. Oxfam International, 19 January 2013.