Warwickshire County Council election, 2009
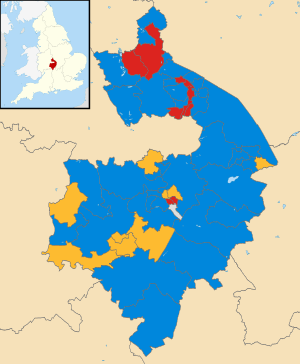
2009 local election results in Warwickshire
Elections to Warwickshire County Council took place on 4 June 2009, having been delayed from 7 May, in order to coincide with elections to the European Parliament.
Summary of Results
| Party | Seats | Gains | Losses | Net gain/loss | Seats % | Votes % | Votes | +/− | |
|---|---|---|---|---|---|---|---|---|---|
| Conservative | 39 | 16 | 4 | +12 | 63% | 43% | 83,186 | +3.75% | |
| Liberal Democrat | 12 | 4 | 3 | +1 | 19% | 23% | 44,260 | -3.87% | |
| Labour | 10 | 0 | 13 | -13 | 16% | 17% | 33,843 | -13.15% | |
| Whitnash Independents | 1 | 0 | 0 | ±0 | 2% | 1% | 1,632 | ||
| Green | 0 | 0 | 0 | ±0 | 0 | 11% | 21,115 | ||
| BNP | 0 | 0 | 0 | ±0 | 0 | 3% | 6,271 | N/A | |
| Other parties | 0 | 0 | 0 | ±0 | 0 | 2% | 3,074 | N/A | |
Divisional Results
North Warwickshire
| Seat | Result | Majority | |
|---|---|---|---|
| Arley | Conservative HOLD | 1,055 | |
| Atherstone | Conservative GAIN from Labour | 87 | |
| Baddlesley | Labour HOLD | 188 | |
| Coleshill | Conservative HOLD | 604 | |
| Hartshill | Conservative GAIN from Labour | 370 | |
| Kingsbury | Labour HOLD | 221 | |
| Polesworth | Conservative GAIN from Labour | 200 | |
| Water Orton | Conservative HOLD | 937 |
Nuneaton and Bedworth
| Seat | Result | Majority | |
|---|---|---|---|
| Abbey | Labour HOLD | ||
| Arbury and Stockingford* | Conservative GAIN from Labour | ||
| Bede | Labour HOLD | ||
| Bedworth North | Conservative GAIN from Labour | ||
| Bedworth West | Labour HOLD | ||
| Bulkington | Conservative HOLD | ||
| Camp Hill | Labour HOLD | ||
| Galley Common | Conservative GAIN from Labour | ||
| Poplar | Labour HOLD | ||
| St. Nicholas | Conservative HOLD | ||
| Weddington | Conservative HOLD | ||
| Wembrook | Labour HOLD | ||
| Whitestone | Conservative HOLD |
| Party | Candidate | Votes | % | ± | |
|---|---|---|---|---|---|
| Green | Alty, James Christopher Myles | 692 | 7.69% | ||
| BNP | Findley, Martyn Russell | 1283 | 14.27% | ||
| Labour | Henry, Pat | 1472 | 16.37% | ||
| Labour | Longden, Barry James | 1480 | 16.46% | ||
| Conservative | Wilson, Sonja Lund | 1582 | 17.59% | ||
| Conservative | Wilson, Tom | 1637 | 18.2% | ||
| Green | Wright, Mike | 848 | 9.43% | ||
| Majority | |||||
| Turnout | |||||
| Party | Candidate | Votes | % | ± | |
|---|---|---|---|---|---|
| Labour | Chattaway, Richard | 1,258 | 45.32% | ||
| BNP | Deacon, Alwyn Mark | 583 | 21.00% | ||
| Conservative | Hadden, Stuart | 578 | 20.82% | ||
| Green | Ingall, Caz | 101 | 3.64% | ||
| English Democrat | Lane, David Ford | 256 | 9.22% | ||
| Majority | |||||
| Turnout | 2,776 | ||||
| Party | Candidate | Votes | % | ± | |
|---|---|---|---|---|---|
| BNP | Bennett, Kevin Paul | 429 | 15.78% | ||
| Labour | Haynes, John | 727 | 26.74% | ||
| Independent | Lane, John Stephen | 309 | 11.36% | ||
| Conservative | Lobbett, Barry | 840 | 30.89% | ||
| Green | Wandless-Phillips, Clare Louise | 414 | 15.23% | ||
| Majority | |||||
| Turnout | 2,719 | ||||
| Party | Candidate | Votes | % | ± | |
|---|---|---|---|---|---|
| Liberal Democrat | Field, Alice Rachel | 289 | 11.31% | ||
| Conservative | Hadden, Chris | 776 | 30.37% | ||
| BNP | Haywood, Darren John | 427 | 16.71% | ||
| Labour | McCarney, Frank | 889 | 34.79% | ||
| Green | Phillips, Ben | 174 | 6.81% | ||
| Majority | |||||
| Turnout | |||||
| Party | Candidate | Votes | % | ± | |
|---|---|---|---|---|---|
| Labour | Beaumont John Brian | ||||
| Green | Patrick Andrew John | ||||
| Conservative | Smith Richard Thomas | ||||
| Majority | |||||
| Turnout | |||||
| Party | Candidate | Votes | % | ± | |
|---|---|---|---|---|---|
| Green | Carter Juliet Anne | ||||
| TUSC | Clark George Alan | ||||
| Labour | Hicks Robert Donald | ||||
| BNP | Lincoln Maureen | ||||
| Conservative | Paxton Stephen James | ||||
| Majority | |||||
| Turnout | |||||
| Party | Candidate | Votes | % | ± | |
|---|---|---|---|---|---|
| Labour | Davies Corinne | ||||
| Conservative | Gutteridge Mark Lancelot | ||||
| BNP | Holmes Jason | ||||
| Green | Jhita Avnash | ||||
| TUSC | Reilly Paul | ||||
| Majority | |||||
| Turnout | |||||
| Party | Candidate | Votes | % | ± | |
|---|---|---|---|---|---|
| Conservative | Foster James | ||||
| Labour | Johnson Philip | ||||
| TUSC | McGuire Paige Louise | ||||
| Green | Watson Marcia Elaine | ||||
| Majority | |||||
| Turnout | |||||
| Party | Candidate | Votes | % | ± | |
|---|---|---|---|---|---|
| Conservative | Clarke Jeffrey | ||||
| Green | Kondakor Michele Marie Pascale | ||||
| TUSC | White Daniel Stephen | ||||
| Labour | Wilson Sonja Lund | ||||
| Majority | |||||
| Turnout | |||||
| Party | Candidate | Votes | % | ± | |
|---|---|---|---|---|---|
| Conservative | Farnell Alan John | ||||
| Green | Kondakor Keith Anthony | ||||
| Labour | Margrave Samuel John | ||||
| TUSC | McGraff Brendan | ||||
| UKIP | Slipper Dennis | ||||
| Majority | |||||
| Turnout | |||||
| Party | Candidate | Votes | % | ± | |
|---|---|---|---|---|---|
| Independent | Harbison Scott George Moreton | ||||
| Green | Horobin Alexander Scott | ||||
| BNP | Kimberley Phillip | ||||
| TUSC | Playdon Peter | ||||
| Independent | Sheppard William Henry | ||||
| Labour | Tandy June Anne | ||||
| Conservative | Walmsley Hayden Brian | ||||
| Majority | |||||
| Turnout | |||||
| Party | Candidate | Votes | % | ± | |
|---|---|---|---|---|---|
| Green | Bonner Ian Charles | ||||
| Labour | Crichton Andrew Stephen | ||||
| Conservative | Heatley Martin Leslie | ||||
| Majority | |||||
| Turnout | |||||
| Party | Candidate | Votes | % | ± | |
|---|---|---|---|---|---|
| BNP | Haycock Glyn David | ||||
| Labour | Jackson Julie Anne | ||||
| Conservative | Llewellyn-Nash Ian Christopher | ||||
| TUSC | Mosey Catherine | ||||
| Majority | |||||
| Turnout | |||||
Rugby
| Seat | Result | Majority | |
|---|---|---|---|
| Admirals | Conservative GAIN from Labour | ||
| Brownsover* | Conservative GAIN from Labour | ||
| Caldecott* | Conservative HOLD | ||
| Dunchurch | Conservative HOLD | ||
| Earl Craven | Conservative HOLD | ||
| Eastlands and Hillmorton* | Liberal Democrats HOLD | ||
| Fosse | Conservative HOLD | ||
| Lawford and New Bilton | Conservative GAIN from Labour |
Stratford upon Avon
| Seat | Result | Majority | |
|---|---|---|---|
| Alcester | Conservative GAIN from Liberal Democrats | ||
| Aston Cantlow | Conservative HOLD | ||
| Bidford on Avon | Liberal Democrats HOLD | ||
| Feldon | Conservative HOLD | ||
| Henley in Arden | Conservative HOLD | ||
| Kineton | Conservative GAIN from Liberal Democrats | ||
| Shipston on Stour | Conservative HOLD | ||
| Southam | Conservative HOLD | ||
| Stour and the Vale | Conservative HOLD | ||
| Stratford Avenue and New Town | Liberal Democrats HOLD | ||
| Stratford South* | Liberal Democrats GAIN from Conservative | ||
| Studley | Liberal Democrats GAIN from Conservative | ||
| Wellesbourne | Liberal Democrats GAIN from Conservative |
Warwick
| Seat | Result | Majority | |
|---|---|---|---|
| Bishop's Tachbrook | Conservative HOLD | ||
| Cubbington | Conservative HOLD | ||
| Kenilworth, Abbey | Liberal Democrats HOLD | ||
| Kenilworth, Park Hill | Conservative GAIN from Liberal Democrats | ||
| Kenilworth, St. John's | Conservative HOLD | ||
| Leamington, Brunswick | Labour HOLD | ||
| Leamington, Milverton | Liberal Democrats HOLD | ||
| Leamington North* | Liberal Democrats HOLD | ||
| Leamington, Willes | Labour HOLD | ||
| Leek Wootton | Conservative HOLD | ||
| Warwick North | Conservative GAIN from Labour | ||
| Warwick South | Conservative HOLD | ||
| Warwick West | Conservative GAIN from Labour | ||
| Whitnash | Independent HOLD |
- Wards marked with a star elect two members
References
- ↑ http://www.nuneatonandbedworth.gov.uk/news/article/181/candidates_for_warwickshire_county_council_elections
- ↑ http://www.nuneatonandbedworth.gov.uk/news/article/181/candidates_for_warwickshire_county_council_elections
- ↑ http://www.nuneatonandbedworth.gov.uk/news/article/181/candidates_for_warwickshire_county_council_elections
- ↑ http://www.nuneatonandbedworth.gov.uk/news/article/181/candidates_for_warwickshire_county_council_elections
- ↑ http://www.nuneatonandbedworth.gov.uk/news/article/181/candidates_for_warwickshire_county_council_elections
- ↑ http://www.nuneatonandbedworth.gov.uk/news/article/181/candidates_for_warwickshire_county_council_elections
- ↑ http://www.nuneatonandbedworth.gov.uk/news/article/181/candidates_for_warwickshire_county_council_elections
- ↑ http://www.nuneatonandbedworth.gov.uk/news/article/181/candidates_for_warwickshire_county_council_elections
- ↑ http://www.nuneatonandbedworth.gov.uk/news/article/181/candidates_for_warwickshire_county_council_elections
- ↑ http://www.nuneatonandbedworth.gov.uk/news/article/181/candidates_for_warwickshire_county_council_elections
- ↑ http://www.nuneatonandbedworth.gov.uk/news/article/181/candidates_for_warwickshire_county_council_elections
- ↑ http://www.nuneatonandbedworth.gov.uk/news/article/181/candidates_for_warwickshire_county_council_elections
- ↑ http://www.nuneatonandbedworth.gov.uk/news/article/181/candidates_for_warwickshire_county_council_elections
| County council elections |
| ||
|---|---|---|---|
| Mayoral elections | |||
| Unitary authorities | |||
| Other English councils |
| ||
Bold indicates a new unitary authority. Stoke-on-Trent cancelled mayoral election after abolishing mayoral system. | |||
This article is issued from
Wikipedia.
The text is licensed under Creative Commons - Attribution - Sharealike.
Additional terms may apply for the media files.