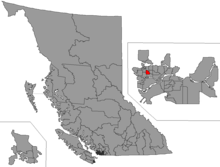
Vancouver-Kensington
 | |||
| Provincial electoral district | |||
| Legislature | Legislative Assembly of British Columbia | ||
| MLA |
New Democratic | ||
| District created | 1991 | ||
| First contested | 1991 | ||
| Last contested | 2013 | ||
Vancouver-Kensington is a provincial electoral district for the Legislative Assembly of British Columbia, Canada.
Demographics
| Population, 2011 | 57,790 |
| Population Change, 2006-2011 | 5.3% |
| Area (km²) | 8.95 |
| Pop. Density (people per km²) | 6,459 |
Election results
| British Columbia general election, 2017 | ||||||||
|---|---|---|---|---|---|---|---|---|
| Party | Candidate | Votes | % | |||||
| New Democratic | Mable Elmore | 12,504 | 55.57 | |||||
| Liberal | Kim Jee Chan Logan | 7,236 | 32.16 | |||||
| Green | Simon Alexander Rear | 2,580 | 11.47 | |||||
| Your Political Party | Ramanjit Kaur Dhillon | 181 | 0.80 | |||||
| Total valid votes | 22,501 | 100.00 | ||||||
| Source: Elections BC[1] | ||||||||
| Party | Candidate | Votes | % | ± | Expenditures | |
|---|---|---|---|---|---|---|
| New Democratic | Mable Elmore | 10,687 | 51.37 | $64,956 | ||
| Liberal | Gabby Kalaw | 7,965 | 38.29 | $63,669 | ||
| Green | Chris Fjell | 1,578 | 7.59 | $2,530 | ||
| Conservative | Raj Gupta | 572 | 2.75 | $6,467 | ||
| Total Valid Votes | 20,802 | 100 | ||||
| Total Rejected Ballots | 254 | 1.21% | ||||
| Turnout | 21,056 | 54.33% | ||||
| British Columbia general election, 2009 | ||||||||
|---|---|---|---|---|---|---|---|---|
| Party | Candidate | Votes | % | Expenditures | ||||
| New Democratic | Mable Elmore | 9,930 | 52.55 | $85,850 | ||||
| Liberal | Syrus Lee | 7,678 | 40.63 | $39,514 | ||||
| Green | Doug Warkentin | 1,288 | 6.82 | $780 | ||||
| Total valid votes | 18,896 | 100 | ||||||
| Total rejected ballots | 210 | 1.1 | ||||||
| Turnout | 19,106 | 51.98 | ||||||
| British Columbia general election, 2005 | ||||||||
|---|---|---|---|---|---|---|---|---|
| Party | Candidate | Votes | % | Expenditures | ||||
| New Democratic | David Chudnovsky | 10,573 | 49.97 | $79,895 | ||||
| Liberal | Patrick Wong | 8,949 | 42.29 | $106,628 | ||||
| Green | Cody Matheson | 1,273 | 6.02 | $893 | ||||
| Marijuana | John Patrick Gordon | 266 | 1.26 | $100 | ||||
| People's Front | Charles Boylan | 99 | 0.47 | $103 | ||||
| Total | 21,160 | |||||||
| Total Rejected Ballots | 302 | 1.4 | ||||||
| Turnout | 21,462 | 58.46 | ||||||
| Party | Candidate | Votes | % | ± | Expenditures | |
|---|---|---|---|---|---|---|
| Liberal | Patrick Wong | 9,162 | 47.56% | $37,139 | ||
| NDP | Ujjal Dosanjh | 7,478 | 38.82% | $62,038 | ||
| Green | Betty Krawczyk | 1,795 | 9.32% | – | $16,056 | |
| Marijuana | John Patrick Gordon | 516 | 2.68% | $721 | ||
| Unity | John Francis O'Flynn | 314 | 1.62% | $1,357 | ||
| Total valid votes | 19,265 | 100.00% | ||||
| Total rejected ballots | 250 | 1.30% | ||||
| Turnout | 19,515 | 73.09% | ||||
| Party | Candidate | Votes | % | ± | Expenditures | |
|---|---|---|---|---|---|---|
| NDP | Ujjal Dosanjh | 9,496 | 50.74% | $49,807 | ||
| Liberal | Gim Huey | 7,608 | 40.65% | $34,923 | ||
| Progressive Democrat | Don Seykens | 537 | 2.87% | – | $100 | |
| Reform | Kirk Pankey | 472 | 2.52% | $1,238 | ||
| Green | Kelly White | 349 | 1.86% | – | $100 | |
| Social Credit | Damon Wong | 135 | 0.72% | – | $1,029 | |
| Family Coalition | Mark Toth | 119 | 0.64% | – | $487 | |
| Total valid votes | 18,716 | 100.00% | ||||
| Total rejected ballots | 218 | 1.15% | ||||
| Turnout | 18,934 | 70.25% | ||||
| Party | Candidate | Votes | % | ± | Expenditures | |
|---|---|---|---|---|---|---|
| NDP | Ujjal Dosanjh | 8,323 | 46.85% | $37,210 | ||
| Liberal | Ted Olynyk | 4,700 | 26.45% | $2,679 | ||
| Social Credit | Gim Huey | 4,389 | 24.70% | – | $51,080 | |
| Green | Bryan Wagman | 155 | 0.87% | – | ||
| Family Coalition | John O'Flynn | 151 | 0.85% | – | $500 | |
| Non-affiliated (Communist League) | Colleen Levis | 49 | 0.28% | $247 | ||
| Total valid votes | 17,767 | 100.00% | ||||
| Total rejected ballots | 644 | 3.50% | ||||
| Turnout | 18,411 | 72.14% | ||||
External links
- BC Stats
- Map
- Results of 2001 election (pdf)
- 2001 Expenditures (pdf)
- Results of 1996 election
- 1996 Expenditures
- Results of 1991 election
- 1991 Expenditures
- Website of the Legislative Assembly of British Columbia
Coordinates: 49°14′31″N 123°04′41″W / 49.242°N 123.078°W
- ↑ "2017 Provincial General Election Preliminary Voting Results". Elections BC. Retrieved 31 May 2017.
This article is issued from
Wikipedia.
The text is licensed under Creative Commons - Attribution - Sharealike.
Additional terms may apply for the media files.