Nanaimo (provincial electoral district)
 | |||
| Provincial electoral district | |||
| Legislature | Legislative Assembly of British Columbia | ||
| MLA |
New Democratic | ||
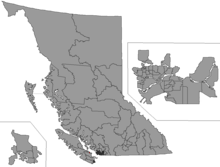
Nanaimo is a provincial electoral district for the Legislative Assembly of British Columbia, Canada.
Demographics
| Population, 2001 | 51,197 |
| Population Change, 1996–2001 | -0.5% |
| Area (km²) | 1,299 |
| Pop. Density (people per km²) | 39 |
History
The district was known as Nanaimo and the Islands from 1941 to 1963. It was formed of parts of the former ridings of Nanaimo and The Islands. In the 1966 election the Nanaimo riding name was restored and the southern part of the riding became Saanich and the Islands. That area is now part of Saanich North and the Islands. An older riding with the name Nanaimo existed from 1871 to 1928.
Member of Legislative Assembly
| Assembly | Years | Member | Party | |
|---|---|---|---|---|
| Nanaimo and the Islands | ||||
| 20th | 1941–1945 | George Sharratt Pearson | Liberal | |
| 21st | 1945–1949 | Coalition | ||
| 22nd | 1949–1952 | |||
| 23rd | 1952–1953 | Larry Giovando | Progressive Conservative | |
| 24th | 1953–1956 | |||
| 25th | 1956–1960 | Earle Westwood | Social Credit | |
| 26th | 1960–1963 | |||
| 27th | 1963–1966 | David Stupich | NDP | |
| Nanaimo | ||||
| 28th | 1966–1969 | David Stupich | NDP | |
| 29th | 1969–1972 | Frank Ney | Social Credit | |
| 30th | 1972–1975 | David Stupich | NDP | |
| 31st | 1975–1979 | |||
| 32nd | 1979–1983 | |||
| 33rd | 1983–1986 | |||
| 34th | 1986–1988 | Dale Lovick David Stupich[1] | ||
| 1989–1991 | Dale Lovick Jan Pullinger | |||
| 35th | 1991–1996 | Dale Lovick | ||
| 36th | 1996–2001 | |||
| 37th | 2001–2005 | Mike Hunter | Liberal | |
| 38th | 2005–2009 | Leonard Krog | NDP | |
| 39th | 2009–2013 | |||
| 40th | 2013–2017 | |||
| 41st | 2017–present | |||
Election results
| British Columbia general election, 2017 | ||||||||
|---|---|---|---|---|---|---|---|---|
| Party | Candidate | Votes | % | |||||
| New Democratic | Leonard Krog | 12,746 | 46.54 | |||||
| Liberal | Paris Gaudet | 8,912 | 32.54 | |||||
| Green | Kathleen Harris | 5,454 | 19.91 | |||||
| Libertarian | Bill Walker | 277 | 1.01 | |||||
| Total valid votes | 27,389 | 100.00 | ||||||
| Source: Elections BC[2] | ||||||||
| British Columbia general election, 2013: Nanaimo | ||||||||
|---|---|---|---|---|---|---|---|---|
| Party | Candidate | Votes | % | |||||
| New Democratic | Leonard Eugene Krog | 10820 | 46.25 | |||||
| Liberal | Walter Douglas Anderson | 8568 | 36.62 | |||||
| Green | Ian Elliot Gartshore | 2532 | 10.82 | |||||
| Conservative | Bryce Nelson Crigger | 1221 | 5.22 | |||||
| Independent | Brunie Brunie | 253 | 1.08 | |||||
| Total valid votes | 23395 | 100.00 | ||||||
| Total rejected ballots | 103 | 0.44 | ||||||
| Turnout | 23498 | 57.96 | ||||||
| Source: Elections BC[3] | ||||||||
| British Columbia general election, 2009 | ||||||||
|---|---|---|---|---|---|---|---|---|
| Party | Candidate | Votes | % | ±% | ||||
| New Democratic | Leonard Krog | 11,877 | 53.33 | +1.43 | ||||
| Liberal | Jeet Manhas | 8,086 | 36.31 | +2.34 | ||||
| Green | Dirk Becker | 2,036 | 9.14 | -2.37 | ||||
| Refederation | Linden Robert Shaw | 272 | 1.22 | +0.56 | ||||
| Total valid votes | 22,271 | 100.00 | ||||||
| Total rejected ballots | 159 | 0.71 | ||||||
| Turnout | 22,430 | 57.11 | ||||||
| Eligible voters | 39,273 | |||||||
| New Democratic hold | Swing | -1.89 | ||||||
| British Columbia general election, 2005 | ||||||||
|---|---|---|---|---|---|---|---|---|
| Party | Candidate | Votes | % | ±% | ||||
| New Democratic | Leonard Krog | 12,405 | 51.90 | +21.67 | ||||
| Liberal | Mike Hunter | 8,657 | 33.97 | -10.67 | ||||
| Green | Doug Catley | 2,933 | 11.51 | -5.94 | ||||
| Marijuana | Mat Dillon | 294 | 1.16 | -2.91 | ||||
| Independent | Brunie Brunie | 204 | 0.80 | -0.12 | ||||
| Refederation | Linden Robert Shaw | 169 | 0.66 | – | ||||
| Total valid votes | 25,483 | 100.00 | ||||||
| Total rejected ballots | 140 | 0.55 | ||||||
| Turnout | 25,623 | 62.83 | ||||||
| Eligible voters | 40,782 | |||||||
| New Democratic gain from Liberal | Swing | +16.17 | ||||||
| British Columbia general election, 2001 | ||||||||
|---|---|---|---|---|---|---|---|---|
| Party | Candidate | Votes | % | ±% | Expenditures | |||
| Liberal | Mike Hunter | 9,748 | 44.64 | +11.28 | $46,911 | |||
| New Democratic | Leonard Krog | 6,602 | 30.23 | -18.52 | $15,152 | |||
| Green | Doug Catley | 3,810 | 17.45 | +15.34 | $3,225 | |||
| Marijuana | Donald Edgar Lavallée | 889 | 4.07 | – | $428 | |||
| Unity | Steve Miller | 588 | 2.69 | – | $1,799 | |||
| Independent | Brunie Brunie | 199 | 0.92 | – | $530 | |||
| Total valid votes | 21,836 | 100.00 | ||||||
| Total rejected ballots | 110 | 0.50 | ||||||
| Turnout | 21,946 | 69.87 | ||||||
| Liberal gain from New Democratic | Swing | +14.90 | ||||||
| Party | Candidate | Votes | % | ± | Expenditures | |
|---|---|---|---|---|---|---|
| NDP | Dale Lovick | 11,210 | 48.75% | $16,425 | ||
| Liberal | Gary Korpan | 7,672 | 33.36% | $52,556 | ||
| Reform | Garry D. Shepp | 1,867 | 8.12% | $6,948 | ||
| Progressive Democrat | David J. Weston | 1,337 | 5.81% | – | $703 | |
| Green | Karen M. Shillington | 486 | 2.11% | – | $250 | |
| Family Coalition | Vicki Podetz | 311 | 1.35% | – | $247 | |
| Libertarian | Mark Chase | 113 | 0.49% | $365 | ||
| Total Valid Votes | 22,996 | 100.00% | ||||
| Total Rejected Ballots | 179 | 0.77% | ||||
| Turnout | 23,175 | 69.79% | ||||
| Party | Candidate | Votes | % | ± | Expenditures | |
|---|---|---|---|---|---|---|
| NDP | Dale Lovick | 11,135 | 51.25% | $39,246 | ||
| Liberal | Raymond A. Brookbank | 7,556 | 34.77% | $1,051 | ||
| Social Credit | Vivian M. Garner | 2,480 | 11.41% | – | $17,601 | |
| Green | Karen M. Shillington | 34 | 1.57% | – | $506 | |
| Family Coalition | David P. Bentley | 145 | 0.67% | – | $226 | |
| Libertarian | Jack Boulogne | 71 | 0.33% | |||
| Total Valid Votes | 21,729 | 100.00% | ||||
| Total Rejected Ballots | 469 | 2.11% | ||||
| Turnout | 22,198 | 74.54% | ||||
| Party | Candidate | Votes | % | ± | Expenditures | |
|---|---|---|---|---|---|---|
| NDP | Jan Pullinger | 14,613 | 57.12% | $36,999 | ||
| Social Credit | Larry McNabb | 9,062 | 35.42% | – | $42,216 | |
| Liberal | Raymond A. Brookbank | 1,908 | 7.46% | $5,414 | ||
| Total Valid Votes | 25,583 | 100.00% | ||||
| Total Rejected Ballots | 183 | 0.71% | ||||
| Turnout | 25,766 | 54.29% | ||||
| Party | Candidate | Votes | % | ± | Expenditures | |
|---|---|---|---|---|---|---|
| NDP | David Stupich | 18,213 | 26.52% | |||
| NDP | Dale Lovick | 17,251 | 25.11% | |||
| Social Credit | Doug McBride | 15,868 | 23.10% | – | ||
| Social Credit | James Alexander (Alex) Stuart | 15,497 | 22.56% | – | ||
| Liberal | Edwin V. Bourke | 1,535 | 2.24% | |||
| Communist | Deborah A. MacDonald | 325 | 0.47% | |||
| Total Valid Votes | 68,689 | 100.00% | ||||
| Total Rejected Ballots | 773 | % | ||||
| Turnout | % | |||||
| 1 two-member seat during this election | ||||||
| Party | Candidate | Votes | % | ± | Expenditures | |
|---|---|---|---|---|---|---|
| NDP | David Stupich | 17,436 | 52.17% | |||
| Social Credit | Graham J.R. Alce | 13,490 | 40.36% | – | ||
| Western Canada Concept | John Lloyd Cowan | 1,090 | 3.26% | |||
| Green | Alan Joseph Timberlake | 625 | 1.87% | – | ||
| Liberal | Shelagh J.F. (Sue) Matthews | 554 | 1.66% | |||
| Independent | Howard Peter Yearwood | 228 | 0.68% | |||
| Total Valid Votes | 33,423 | 100.00% | ||||
| Total Rejected Ballots | 269 | % | ||||
| Turnout | % | |||||
| Party | Candidate | Votes | % | ± | Expenditures | |
|---|---|---|---|---|---|---|
| NDP | David Stupich | 17,021 | 58.69% | |||
| Social Credit | Thomas Wesley (Tom) Humble | 11,979 | 41.31% | – | ||
| Total Valid Votes | 29,000 | 100.00% | ||||
| Total Rejected Ballots | 420 | % | ||||
| Turnout | % | |||||
| Party | Candidate | Votes | % | ± | Expenditures | |
|---|---|---|---|---|---|---|
| NDP | David Stupich | 12,177 | 49.08% | |||
| Social Credit | Graeme C. Roberts | 11,041 | 44.50% | – | ||
| Progressive Conservative | Marjorie Ennis Moore | 869 | 3.50% | |||
| Liberal | William Harold Matthews | 636 | 2.56% | |||
| Communist | Raymond Holmgren | 90 | 0.36% | |||
| Total Valid Votes | 24,813 | 100.00% | ||||
| Total Rejected Ballots | 187 | % | ||||
| Turnout | % | |||||
| Party | Candidate | Votes | % | ± | Expenditures | |
|---|---|---|---|---|---|---|
| NDP | David Stupich | 10,478 | 52.60% | |||
| Social Credit | Frank Ney | 6,409 | 32.17% | – | ||
| Progressive Conservative | Graeme C. Roberts | 1,880 | 9.44% | |||
| Liberal | Lloyd Schoop | 916 | 4.60% | |||
| Independent | Nelson Edward Allen | 238 | 1.19% | |||
| Total Valid Votes | 19,921 | 100.00% | ||||
| Total Rejected Ballots | 327 | % | ||||
| Turnout | % | |||||
| Party | Candidate | Votes | % | ± | Expenditures | |
|---|---|---|---|---|---|---|
| Social Credit | Frank Ney | 8,252 | 49.22% | – | ||
| NDP | David Stupich | 7,790 | 46.47% | |||
| Liberal | Robert Steven Plecas | 722 | 4.31% | |||
| Total Valid Votes | 16,764 | 100.00% | ||||
| Total Rejected Ballots | 153 | % | ||||
| Turnout | % | |||||
| Party | Candidate | Votes | % | ± | Expenditures | |
|---|---|---|---|---|---|---|
| NDP | David Stupich | 5,625 | 47.99% | |||
| Social Credit | Frank Ney | 5,580 | 47.61% | – | ||
| Liberal | Robert Paul Goseltine | 516 | 4.40% | |||
| Total Valid Votes | 11,721 | 100.00% | ||||
| Total Rejected Ballots | 114 | % | ||||
| Turnout | % | |||||
Nanaimo and The Islands (1941-1966)
| Party | Candidate | Votes | % | ± | Expenditures | |
|---|---|---|---|---|---|---|
| NDP | David Stupich | 4,278 | 42.44% | unknown | ||
| Liberal | Robert Clayton Weir | 960 | 9.52% | unknown | ||
| Social Credit | Earle Cathers Westwood | 4,259 | 42.26% | – | unknown | |
| Progressive Conservative | Cornelia Petronella Adriana Wildman | 582 | 5.77% | unknown | ||
| Total valid votes | 10,079 | 100.00% | ||||
| Total rejected ballots | 79 | |||||
| Turnout | 65.33% | |||||
| Party | Candidate | Votes | % | ± | Expenditures | |
|---|---|---|---|---|---|---|
| Co-operative Commonwealth Fed. | Colin Cameron | 4,548 | 41.87% | unknown | ||
| Liberal | Hugh Basil Heath | 1,036 | 9.54% | unknown | ||
| Communist | Irving Floyd Mortensen | 72 | 0.66% | unknown | ||
| Progressive Conservative | Edward Drewry Strongitharm | 607 | 5.59% | unknown | ||
| Social Credit | Earle Cathers Westwood | 4,599 | 42.34% | – | unknown | |
| Total valid votes | 10,862 | 100.00% | ||||
| Total rejected ballots | 151 | |||||
| Turnout | % | |||||
| Party | Candidate | Votes | % | ± | Expenditures | |
|---|---|---|---|---|---|---|
| Independent | Edward Joseph Brewster | 69 | 0.77% | unknown | ||
| Co-operative Commonwealth Fed. | Arthur Roderick Glen | 2,963 | 32.92% | unknown | ||
| Liberal | Peter Maffeo | 2,142 | 23.80% | unknown | ||
| Social Credit | Earle Cathers Westwood | 3,827 | 45.52% | – | unknown | |
| Total valid votes | 9,001 | 100.00% | ||||
| Total rejected ballots | 109 | |||||
| Turnout | % | |||||
| 24th British Columbia election, 1953 2 | ||||||||
|---|---|---|---|---|---|---|---|---|
| Party | Candidate | Votes 1st count |
% | Votes final count |
% | ±% | ||
| Liberal | Elmer Pearce Bradshaw | 1,375 | 13.99% | - | - % | unknown | ||
| Independent | Edward Joseph Brewster | 32 | 0.33% | - | - % | unknown | ||
| Progressive Conservative | Larry Giovando | 2,046 | 20.82% | 4,376 | 50.10% | unknown | ||
| Co-operative Commonwealth Fed. | David Stupich | 3,631 | 36.96% | 4,358 | 49.90% | unknown | ||
| Labor-Progressive | Grace Ellen Tickson | 115 | 1.17% | - | -% | unknown | ||
| Social Credit | Earle Cathers Westwood | 2,626 | 26.73% | |||||
| Total valid votes | 9,825 | 100.00% | 8,734 | % | ||||
| Total rejected ballots | 363 | |||||||
| Total Registered Voters | ||||||||
| Turnout | % | |||||||
| Preferential ballot; final count is between top two candidates from first count; intermediary counts (of 5) not shown | ||||||||
| 23rd British Columbia election, 19521 | ||||||||
|---|---|---|---|---|---|---|---|---|
| Party | Candidate | Votes 1st count |
% | Votes final count |
% | ±% | ||
| Liberal | Elmer Pearce Bradshaw | 2,263 | 21.59% | - | - % | unknown | ||
| Social Credit League | Edward Joseph Brewster | 951 | 9.07% | |||||
| Progressive Conservative | Larry Giovando | 3,346 | 31.92% | 5,144 | 52.89% | unknown | ||
| Labor-Progressive | Nigel Morgan | 207 | 1.97% | - | -% | unknown | ||
| Co-operative Commonwealth Fed. | David Stupich | 3,715 | 35.44% | 4,581 | 47.11% | unknown | ||
| Total valid votes | 10,482 | 100.00% | 9,725 | % | ||||
| Total rejected ballots | 207 | |||||||
| Turnout | % | |||||||
| 1 Preferential ballot; final count is between top two candidates from first count; intermediary counts (of 4) not shown | ||||||||
| Party | Candidate | Votes | % | ± | Expenditures | |
|---|---|---|---|---|---|---|
| Coalition | George Sharratt Pearson | 5,860 | 61.50% | – | unknown | |
| Co-operative Commonwealth Fed. | David Stupich | 3,564 | 37.41% | unknown | ||
| Union of Electors | Herbert William Summers | 104 | 1.09% | – | unknown | |
| Total valid votes | 9,528 | 100.00% | ||||
| Total rejected ballots | 58 | |||||
| Turnout | % | |||||
| Party | Candidate | Votes | % | ± | Expenditures | |
|---|---|---|---|---|---|---|
| Social Credit Alliance | George Henry Broughton | 89 | 1.55% | – | unknown | |
| Coalition | George Sharratt Pearson | 3,124 | 54.24% | – | unknown | |
| Co-operative Commonwealth Fed. | Joseph White | 2,547 | 44.22% | unknown | ||
| Total valid votes | 5,760 | 100.00% | ||||
| Total rejected ballots | 66 | |||||
| Turnout | 63.19% | |||||
| Party | Candidate | Votes | % | ± | Expenditures | |
|---|---|---|---|---|---|---|
| Conservative | Victor Birch Harrison | 1,208 | 24.17% | unknown | ||
| Co-operative Commonwealth Fed. | Thomas O'Connor | 1,615 | 32.31% | unknown | ||
| Liberal | George Sharratt Pearson | 2,175 | 43.52% | unknown | ||
| Total valid votes | 4,998 | 100.00% | ||||
| Total rejected ballots | 62 | |||||
| Turnout | % | |||||
External links
References
- ↑ Seat at this time was a two-member seat Dave Stupich resigned in 1988, Lovick continued to represent district solo until joined by Jan Pullinger in 1989.
- ↑ "2017 Provincial General Election Preliminary Voting Results". Elections BC. Retrieved 11 May 2017.
- ↑ "Statement of Votes - 40th Provincial General Election" (PDF). Elections BC. Retrieved 17 May 2017.
Coordinates: 49°09′44″N 123°56′16″W / 49.16218°N 123.93771°W
This article is issued from
Wikipedia.
The text is licensed under Creative Commons - Attribution - Sharealike.
Additional terms may apply for the media files.