Valencia City Council election, 2003
|
| |||||||||||||||||||||||||||||||||||||||||
| |||||||||||||||||||||||||||||||||||||||||
All 33 seats in the City Council of Valencia 17 seats needed for a majority | |||||||||||||||||||||||||||||||||||||||||
|---|---|---|---|---|---|---|---|---|---|---|---|---|---|---|---|---|---|---|---|---|---|---|---|---|---|---|---|---|---|---|---|---|---|---|---|---|---|---|---|---|---|
| Registered |
631,225 | ||||||||||||||||||||||||||||||||||||||||
| Turnout |
432,366 (68.5%) | ||||||||||||||||||||||||||||||||||||||||
| |||||||||||||||||||||||||||||||||||||||||
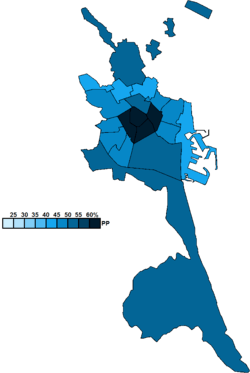 District results map for the City Council of Valencia | |||||||||||||||||||||||||||||||||||||||||
| |||||||||||||||||||||||||||||||||||||||||
.jpg)

.jpg)
The 2003 Valencia City Council election, also the 2003 Valencia municipal election, was held on Sunday, 25 May 2003, to elect the 7th City Council of the municipality of Valencia. All 33 seats in the City Council were up for election. The election was held simultaneously with regional elections in thirteen autonomous communities and local elections all throughout Spain.
Electoral system
The City Council of Valencia (Valencian: Ajuntament de Valencia, Spanish: Ayuntamiento de Valencia) was the top-tier administrative and governing body of the municipality of Valencia, composed of the mayor, the government council and the elected plenary assembly. Voting for the local assembly was on the basis of universal suffrage, which comprised all nationals over eighteen, registered in the municipality of Valencia and in full enjoyment of their political rights, as well as resident non-national European citizens and those whose country of origin allowed Spanish nationals to vote in their own elections by virtue of a treaty.[1][2][3]
Local councillors were elected using the D'Hondt method and a closed list proportional representation, with a threshold of 5 percent of valid votes—which included blank ballots—being applied. Parties not reaching the threshold were not taken into consideration for seat distribution.[1][2][3] Councillors were allocated to municipal councils based on the following scale:
| Population | Councillors |
|---|---|
| <250 | 5 |
| 251–1,000 | 7 |
| 1,001–2,000 | 9 |
| 2,001–5,000 | 11 |
| 5,001–10,000 | 13 |
| 10,001–20,000 | 17 |
| 20,001–50,000 | 21 |
| 50,001–100,000 | 25 |
| >100,001 | +1 per each 100,000 inhabitants or fraction +1 if total is an even number |
The mayor was indirectly elected by the plenary assembly. A legal clause required that mayoral candidates earned the vote of an absolute majority of councillors, or else the candidate of the most-voted party in the assembly was to be automatically appointed to the post. In case of a tie, a toss-up would determine the appointee.[3]
The electoral law provided that parties, federations, coalitions and groupings of electors were allowed to present lists of candidates. However, groupings of electors were required to secure the signature of a determined amount of the electors registered in the municipality for which they sought election. For the case of Valencia, as its population was between 300,001 and 1,000,000, at least 5,000 signatures were required. Concurrently, parties and federations intending to enter in coalition to take part jointly at an election were required to inform the relevant Electoral Commission within ten days of the election being called.[1][2]
Results
 | ||||||
| Parties and coalitions | Popular vote | Seats | ||||
|---|---|---|---|---|---|---|
| Votes | % | ±pp | Total | +/− | ||
| People's Party (PP) | 220,548 | 51.15 | –2.10 | 19 | –1 | |
| Socialist Party of the Valencian Country (PSPV–PSOE) | 132,903 | 30.82 | +1.87 | 12 | +1 | |
| United Left–Valencian Left: Agreement (Entesa) | 31,519 | 7.31 | +0.94 | 2 | ±0 | |
| Valencian Union (UV) | 15,593 | 3.62 | –1.12 | 0 | ±0 | |
| Valencian Nationalist Bloc–Green Left (Bloc–EV) | 11,201 | 2.60 | –0.61 | 0 | ±0 | |
| Cannabis Party for Legalisation and Normalisation (PCLyN) | 4,177 | 0.97 | New | 0 | ±0 | |
| The Greens of the Valencian Country (EV–LV) | 3,369 | 0.78 | New | 0 | ±0 | |
| Spain 2000 (E–2000) | 819 | 0.19 | New | 0 | ±0 | |
| Family and Life Party (PFyV) | 732 | 0.17 | New | 0 | ±0 | |
| Republican Left of the Valencian Country–Municipal Agreement (ERPV–AM) | 692 | 0.16 | New | 0 | ±0 | |
| Alternative Citizen Initiative (ICAL) | 532 | 0.12 | New | 0 | ±0 | |
| Regional Party of the Valencian Community (PRCV) | 509 | 0.12 | New | 0 | ±0 | |
| Democratic and Social Centre (CDS) | 461 | 0.11 | –0.03 | 0 | ±0 | |
| Federal Republican Party (PRF) | 441 | 0.10 | –0.02 | 0 | ±0 | |
| Internationalist Socialist Workers' Party (POSI) | 354 | 0.08 | New | 0 | ±0 | |
| Humanist Party (PH) | 300 | 0.07 | –0.02 | 0 | ±0 | |
| Blank ballots | 7,007 | 1.63 | –0.22 | |||
| Total | 431,157 | 33 | ±0 | |||
| Valid votes | 431,157 | 99.72 | +0.08 | |||
| Invalid votes | 1,209 | 0.28 | –0.08 | |||
| Votes cast / turnout | 432,366 | 68.50 | +5.78 | |||
| Abstentions | 198,859 | 31.50 | –5.78 | |||
| Registered voters | 631,225 | |||||
| Sources[4][5][6][7] | ||||||
References
- 1 2 3 "General Electoral System Organic Law of 1985". Organic Law No. 5 of 19 June 1985. Official State Gazette (in Spanish). Retrieved 28 December 2016.
- 1 2 3 "Representation of the people Institutional Act". juntaelectoralcentral.es. Central Electoral Commission. Retrieved 16 June 2017.
- 1 2 3 "Regulation of the Basis of Local Regimes Law of 1985". Law No. 7 of 2 April 1985. Official State Gazette (in Spanish). Retrieved 27 August 2017.
- ↑ "Local election results, 25 May 2003" (PDF). juntaelectoralcentral.es (in Spanish). Central Electoral Commission. Retrieved 16 February 2018.
- ↑ "Municipal Elections. Valencia" (PDF). valencia.es (in Spanish). City Council of Valencia. Retrieved 5 December 2017.
- ↑ "Electoral Results Consultation. Municipal. May 2003. Valencia Municipality". infoelectoral.mir.es (in Spanish). Ministry of the Interior. Retrieved 12 November 2017.
- ↑ "Municipal elections in Valencia since 1979". historiaelectoral.com (in Spanish). Electoral History. Retrieved 30 September 2017.