| 1951 Pacific typhoon season |
|---|
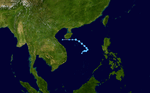
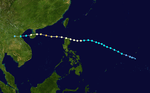
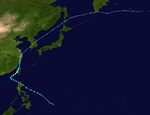
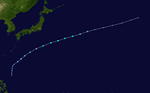
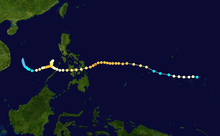
 Season summary map |
| Seasonal boundaries |
|---|
| First system formed |
February 19, 1951 |
|---|
| Last system dissipated |
December 16, 1951 |
|---|
| Strongest storm |
|---|
|
|
| Name |
Marge |
|---|
| • Maximum winds |
185 km/h (115 mph)
(1-minute sustained) |
|---|
| • Lowest pressure |
886 hPa (mbar) |
|---|
|
|
| Seasonal statistics |
|---|
| Total depressions |
31 |
|---|
| Total storms |
25 |
|---|
| Typhoons |
16 |
|---|
| Super typhoons |
1 (unofficial) |
|---|
| Total fatalities |
1,185 (including missing and injured) |
|---|
| Total damage |
$106.15 million (1951 USD) |
|---|
| Related articles |
|---|
|
|
|
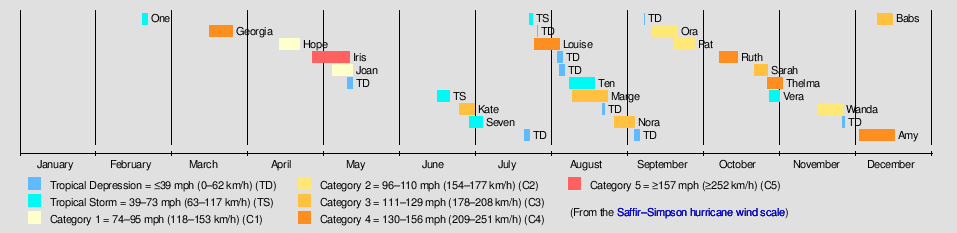
The 1951 Pacific typhoon season was a generally below average season with multiple tropical cyclones striking the Philippines. With the exception of January, each month saw at least one tropical system develop; October was the most active month with four tropical cyclones forming. Overall, there were 21 tropical depressions, of which 17 became named storms; of those, there were 16 typhoons.
The season began with the formation of a short-lived unnamed tropical storm on February 19, well east of the Philippines; Typhoon Georgia became the season's first named storm and typhoon after first developing in the open Pacific on March 20. In April, Typhoon Iris developed before intensifying into a super typhoon the following month; Iris was the first recorded instance of a Category 5-equivalent typhoon in the western Pacific. The final typhoon and storm of the year was Typhoon Babs, which remained at sea before dissipating on December 17.
The scope of this article is limited to the Pacific Ocean, north of the equator and west of the International Date Line. Storms that form east of the date line and north of the equator are called hurricanes; see 1951 Pacific hurricane season. At the time, tropical storms that formed within this region of the western Pacific were named and identified by the United States Fleet Weather Center in Guam. However, the Japan Meteorological Agency (JMA), which was established five years later, identified four additional tropical cyclones during the season not tracked by the Fleet Weather Center; these analyzed systems did not receive names.
Systems
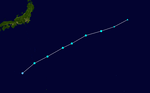
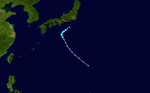
JMA Tropical Storm One
|
Tropical Storm (JMA) |
|
|
| Duration |
February 19 – February 21 |
|---|
| Peak intensity |
Winds not specified 990 hPa (mbar) |
|---|
At 0600 UTC on February 19, a tropical cyclone developed well east of the Philippines and began to track northeastward. Late on February 20, the tropical cyclone reached its peak intensity with a minimum central pressure of 990 mbar (hPa; 29.23 inHg) shortly before becoming extratropical; the consequent extratropical cyclone continued to strengthen before dissipating on February 21. This cyclone was not operationally tracked by the Guam Fleet Weather Center, and as such was added to the season by the Japan Meteorological Agency in 1990.[1]
Typhoon Georgia
|
Typhoon (JMA) |
|
Category 4 typhoon (SSHWS) |
|
|
| Duration |
March 18 – March 27 |
|---|
| Peak intensity |
220 km/h (140 mph) (1-min) 970 hPa (mbar) |
|---|
A persistent low-pressure area south of Kusaie was first noted on March 14. The origins of the cyclonic circulation remain disputed, with one hypothesis indicating initial development south of Nauru and another suggesting that the system originated from a minor tropical wave east of the Marshall Islands. Nonetheless, southeasterly flow associated with an unusually strong high pressure area positioned over northeastern Australia aided the tropical cyclogenesis of the disturbance,[2] and at 1200 UTC on March 18, the circulation developed into a tropical depression. In its initial stages, the disturbance steadily intensified as it moved in a northeasterly direction, attaining tropical storm strength by 1800 UTC the next day. At 0600 UTC on March 20, Georgia reached typhoon intensity;[3] however, the Guam Fleet Warning Center only issued its first typhoon bulletin on the tropical cyclone at 0600 UTC the following day,[2] by which time Georgia already had winds of 185 km/h (115 mph), equivalent to a Category 3 hurricane on the Saffir–Simpson hurricane wind scale.[3] At the same time, the typhoon began to develop an eye.[2] Subsequently, Georgia attained its peak intensity with maximum sustained winds of 220 km/h (140 mph), equivalent to a modern-day Category 4 hurricane. Afterwards, the intense typhoon began to quickly lose organization and strength,[2] and degenerated into a remnant low after 0600 UTC on March 25,[3] coinciding with the last typhoon bulletin issued by the Guam Fleet Warning Center.[2] The remnants tracked westward before dissipating after 0600 UTC on March 28.[4]
As a developing tropical system, the precursor to Georgia and resultant tropical depression moved near Kusaie, producing a peak rainfall total of 137 mm (5.31 in) over a three-day period and gusts in excess of 95 km/h (55 mph). On March 20, Georgia passed to the south of Kwajalein. As such, the island's station observed "strong surface winds" and 236 mm (9.28 in) of rain in an eighteen-hour period.[2] As a weakening tropical cyclone, Georgia threatened Wake Island and Eniwetok Atoll; the latter of which was expected to be the site of American nuclear testing operations.[5] Though both islands were warned of by the Guam Fleet Weather Center, however, the typhoon had weakened considerably before reaching them, and effects remained marginal. Nonetheless, 52 mm (2.03 in) of rain was reported on a weather station in Eniwetok.[2] The nuclear testing operation, termed Operation George, remained unaffected,[6] though the first test was detonated on July 4, well after Georgia dissipated.[7]
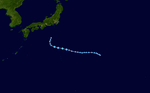
Typhoon Hope
|
Typhoon (JMA) |
|
Category 1 typhoon (SSHWS) |
|
|
| Duration |
April 15 – April 23 |
|---|
| Peak intensity |
130 km/h (80 mph) (1-min) 980 hPa (mbar) |
|---|
In early April, several cyclonic vorticies were noted south of the Marshall Islands. One of these circulation centers tracked westward and later developed into a tropical depression near Micronesia early on April 15.[8][9] Steadily intensifying, the disturbance intensified into a tropical storm by 1800 UTC the next day. At roughly the same time, Hope began to curve slightly to the north. The Guam Fleet Warning Center estimated that the tropical storm intensified into a typhoon by 1800 UTC on April 17, before strengthening further to reach its peak intensity with maximum sustained winds of 130 km/h (80 mph) at 0000 UTC.[9] At the same time, the weather center at Andersen Air Force Base in Guam began issuing bulletins on the storm. Shortly after, Hope executed a small anticyclonic loop, which resulted in the tropical cyclone tracking westward. After this loop was completed, however, the typhoon began to weaken.[8] This weakening trend continued, and the Guam Fleet Warning Center ceased the issuance of bulletins at 1200 UTC on April 20, by which time Hope was deemed too weak to be classified as a tropical cyclone. However, the China Meteorological Agency (CMA), in analysis of the system, determined that Hope had persisted up until late on April 23 before dissipating.[9]
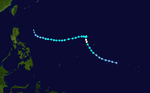
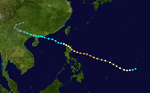
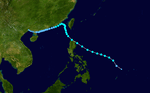
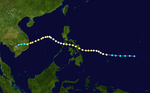
Typhoon Iris
|
Typhoon (JMA) |
|
Category 5 super typhoon (SSHWS) |
|
|
| Duration |
April 28 – May 11 |
|---|
| Peak intensity |
280 km/h (175 mph) (1-min) 909 hPa (mbar) |
|---|
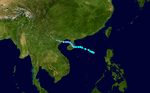
In late April, a well-developed tropical wave began developing east of Chuuk Lagoon.[10] Tracking westward, the easterly wave was analyzed to have organized into a tropical depression by 0000 UTC on April 29.[11] Twelve hours later, Iris was estimated to have strengthened into a tropical storm.[12] At roughly the same time, a vessel in the vicinity of the storm reported winds in excess of 65 km/h (40 mph), prompting the Guam Fleet Weather Center to initiate reconnaissance flights into the cyclone.[8] Midday on April 30, Iris intensified into the equivalent of a modern-day typhoon as it moved in a slightly oscillatory path towards the Philippines.[8][12] After a slight fluctuation in intensity during the overnight hours of May 1, Iris rapidly intensified to reach its peak intensity with a minimum pressure of 909 mbar (hPa; 26.85 inHg) and maximum sustained winds of 280 km/h (175 mph) early on May 4,[12] making it the equivalent of a Category 5 super typhoon;[11] at the time this was the first confirmed instance of a typhoon reaching such intensities.[3] Afterwards, Iris weakened slightly before making landfall on South Luzon around 1800 UTC the following day.[12]
After passing and weakening through the Philippines, Iris emerged into the South China Sea on May 6 as a tropical storm. At the same time, it began to recurve towards the northeast. On May 9, Iris reached a secondary peak intensity south of the Ryukyu Islands with winds of 160 km/h (100 mph), before subsequently weakening.[12] Afterwards, the tropical cyclone underwent extratropical transition, though the timing of such an event is disputed between the JMA and the CMA, with the former indicating that such a transition occurred on May 11,[13] and the latter indicating a transition on May 14.[11] Nonetheless, Iris made an anticyclonic loop beginning on May 11, before accelerating northeastward and dissipating entirely on May 15.[12] Upon its dissipation, Iris set Guam Fleet Weather Center records for number of tropical cyclone bulletins issued, at 50, and number of reconnaissance fixes, at 54.[8][12] At its landfall in the Philippines, the typhoon caused nine fatalities and injured an additional 39 people.[14] Rainfall peaked at 484.4 mm (19.07 in) in Gandara, Samar, with observed winds peaking at 155 km/h (95 mph) in nearby Catbalogan. Damage to highways, bridges, and crops was estimated at ₱19.2 million (US$9.5 million).[15]
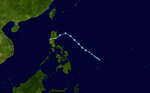
Typhoon Joan
|
Category 1 typhoon (SSHWS) |
|
|
| Duration |
May 6 – May 13 |
|---|
| Peak intensity |
140 km/h (85 mph) (1-min) 980 hPa (mbar) |
|---|
CMA Tropical Depression Five
|
Tropical depression (CMA) |
|
|
| Duration |
May 12 – May 13 |
|---|
| Peak intensity |
55 km/h (35 mph) (10-min) 998 hPa (mbar) |
|---|
CMA Tropical Storm Six
|
Tropical Storm (JMA) |
|
|
| Duration |
June 17 – June 21 |
|---|
| Peak intensity |
75 km/h (45 mph) (10-min) 992 hPa (mbar) |
|---|
Typhoon Kate
|
Typhoon (JMA) |
|
Category 3 typhoon (SSHWS) |
|
|
| Duration |
June 26 – July 2 |
|---|
| Peak intensity |
185 km/h (115 mph) (1-min) 975 hPa (mbar) |
|---|
JMA Tropical Storm Seven
|
Tropical Storm (JMA) |
|
|
| Duration |
July 1 – July 9 |
|---|
| Peak intensity |
95 km/h (60 mph) (10-min) 992 hPa (mbar) |
|---|
CMA Tropical Depression Ten
|
Tropical depression (CMA) |
|
|
| Duration |
July 22 – July 24 |
|---|
| Peak intensity |
55 km/h (35 mph) (10-min) 1002 hPa (mbar) |
|---|
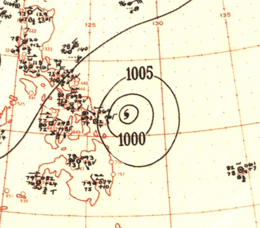
JMA Tropical Storm Eight
|
Tropical Storm (JMA) |
|
|
| Duration |
July 22 – July 26 |
|---|
| Peak intensity |
Winds not specified 1005 hPa (mbar) |
|---|
CMA Tropical Depression Eleven
|
Tropical depression (JMA) |
|
|
| Duration |
July 27 – July 27 |
|---|
| Peak intensity |
45 km/h (30 mph) (10-min) 1006 hPa (mbar) |
|---|
Typhoon Louise
|
Category 4 typhoon (SSHWS) |
|
|
| Duration |
July 26 – August 5 |
|---|
| Peak intensity |
220 km/h (140 mph) (1-min) 904 hPa (mbar) |
|---|
CMA Tropical Depression Thirteen
|
Tropical depression (CMA) |
|
|
| Duration |
August 4 – August 6 |
|---|
| Peak intensity |
55 km/h (35 mph) (10-min) 1002 hPa (mbar) |
|---|
CMA Tropical Depression Fourteen
|
Tropical depression (CMA) |
|
|
| Duration |
August 5 – August 7 |
|---|
| Peak intensity |
55 km/h (35 mph) (10-min) 995 hPa (mbar) |
|---|
JMA Tropical Storm Ten
|
Tropical Storm (JMA) |
|
|
| Duration |
August 9 – August 19 |
|---|
| Peak intensity |
95 km/h (60 mph) (10-min) 989 hPa (mbar) |
|---|
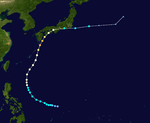
Typhoon Marge
|
Typhoon (JMA) |
|
Category 3 typhoon (SSHWS) |
|
|
| Duration |
August 10 – August 24 |
|---|
| Peak intensity |
185 km/h (115 mph) (1-min) 886 hPa (mbar) |
|---|
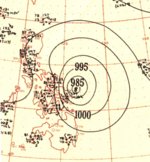
Marge reached a pressure below 900 hPa, becoming the most second most intense of the season.
CMA Tropical Depression Seventeen
|
Tropical depression (CMA) |
|
|
| Duration |
August 22 – August 23 |
|---|
| Peak intensity |
55 km/h (35 mph) (10-min) 1005 hPa (mbar) |
|---|
Typhoon Nora
|
Typhoon (JMA) |
|
Category 3 typhoon (SSHWS) |
|
|
| Duration |
August 27 – September 4 |
|---|
| Peak intensity |
185 km/h (115 mph) (1-min) 970 hPa (mbar) |
|---|
CMA Tropical Depression Nineteen
|
Tropical depression (JMA) |
|
|
| Duration |
September 4 – September 6 |
|---|
| Peak intensity |
55 km/h (35 mph) (10-min) 995 hPa (mbar) |
|---|
CMA Tropical Depression Twenty
|
Tropical depression (CMA) |
|
|
| Duration |
September 8 – September 8 |
|---|
| Peak intensity |
55 km/h (35 mph) (10-min) 1000 hPa (mbar) |
|---|
Typhoon Ora
|
Typhoon (JMA) |
|
Category 2 typhoon (SSHWS) |
|
|
| Duration |
September 11 – September 21 |
|---|
| Peak intensity |
155 km/h (100 mph) (1-min) 980 hPa (mbar) |
|---|
Typhoon Pat
|
Typhoon (JMA) |
|
Category 2 typhoon (SSHWS) |
|
|
| Duration |
September 20 – September 28 |
|---|
| Peak intensity |
165 km/h (105 mph) (1-min) 980 hPa (mbar) |
|---|
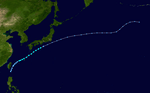
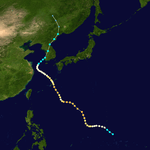
Typhoon Ruth
|
Typhoon (JMA) |
|
Category 4 typhoon (SSHWS) |
|
|
| Duration |
October 8 – October 15 |
|---|
| Peak intensity |
220 km/h (140 mph) (1-min) 924 hPa (mbar) |
|---|
Typhoon Ruth struck Japan on October 15, killing 1294 people and destroying 34,000 buildings.
Typhoon Sarah
|
Typhoon (JMA) |
|
Category 3 typhoon (SSHWS) |
|
|
| Duration |
October 22 – October 27 |
|---|
| Peak intensity |
185 km/h (115 mph) (1-min) 960 hPa (mbar) |
|---|
Typhoon Thelma
|
Typhoon (JMA) |
|
Category 4 typhoon (SSHWS) |
|
|
| Duration |
October 27 – November 1 |
|---|
| Peak intensity |
230 km/h (145 mph) (1-min) 950 hPa (mbar) |
|---|
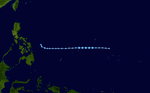
Thelma formed as a Tropical Storm on October 27 and strengthened to category 4 status with 145 mph winds. Thelma later curved away without affecting land at all before it dissipated on October 2. It did not affect land. It was one of the strongest of the season, however damage was minimal, and no deaths were reported. [16]
Tropical Storm Vera
|
Tropical Storm (JMA) |
|
Tropical storm (SSHWS) |
|
|
| Duration |
October 28 – November 1 |
|---|
| Peak intensity |
110 km/h (70 mph) (1-min) 980 hPa (mbar) |
|---|
Vera remained at Tropical Storm status and did not affect land at all, thus being a minimal storm
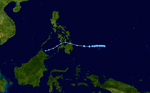
Typhoon Wanda
|
Typhoon (JMA) |
|
Category 2 typhoon (SSHWS) |
|
|
| Duration |
November 16 – November 26 |
|---|
| Peak intensity |
165 km/h (105 mph) (1-min) 985 hPa (mbar) |
|---|
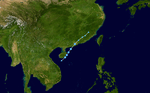
On November 21, Typhoon Wanda moved across the Visayas and southern Luzon. The storm impacts fatally injured 82 people and displaced 213,242 others from their homes.[17]
CMA Tropical Depression Twenty-eight
|
Tropical depression (CMA) |
|
|
| Duration |
November 26 – November 27 |
|---|
| Peak intensity |
45 km/h (30 mph) (10-min) 1004 hPa (mbar) |
|---|
Typhoon Amy
|
Typhoon (JMA) |
|
Category 4 typhoon (SSHWS) |
|
|
| Duration |
December 3 – December 17 |
|---|
| Peak intensity |
220 km/h (140 mph) (1-min) 950 hPa (mbar) |
|---|
On December 3, an area of low pressure first noted near the Kwajalein Atoll developed into a tropical cyclone. Tracking in a general westward direction, the storm quickly intensified to reach typhoon intensity the next day. However, the typhoon's asymmetricity resulted in a fluctuation of intensity over the following few days.[8][18] Afterwards, Amy was able to intensify to reach its peak intensity with maximum sustained winds of 220 km/h (140 mph) and a minimum barometric pressure of 950 mbar (hPa; 28.05 inHg) on December 8. Over the ensuing two days, Amy moved over several islands in the central Philippines before emerging in the South China Sea on December 11 as the equivalent of a minimal typhoon. Shortly after, the tropical cyclone executed a tight anticyclonic loop while oscillating in strength several times before eventually weakening and dissipating on December 17,[8][18] just east of Vietnam.[18]
In the Philippines, Amy was considered one of the worst typhoons to strike the island chain on record.[19] Making its initial landfall along with the concurrent eruption of Mount Hibok-Hibok on Camiguin, the typhoon disrupted volcanic relief operations and forced the displacement of victims already displaced by the volcano.[20][21] Cebu City suffered the worst impacts of Amy – most of the city's buildings were heavily damaged, and 29 people died in the city.[22][23] Strong winds and rainfall in the city associated with Amy also set records which still remain unbroken today.[24] Damage there was estimated at ₱560 million.[25] Along the east coast of Leyte, where Amy initially struck, ninety percent of homes were destroyed,[26] and a large swath of coconut plantations were wiped out.[27] In Panay, located on the western side of the Philippines, at least a thousand homes were destroyed in 41 towns.[28] Overall, Amy caused $30 million in damage,[29][30] and at least 556 fatalities,[31] though the final death toll may have been as high as 991, making the typhoon one of the deadliest in modern Philippine history.[19] An additional 50,000 people were displaced by the storm.[29]
Typhoon Babs
|
Typhoon (JMA) |
|
Category 3 typhoon (SSHWS) |
|
|
| Duration |
December 10 – December 16 |
|---|
| Peak intensity |
185 km/h (115 mph) (1-min) 980 hPa (mbar) |
|---|