Transportation safety in the United States
Transportation safety in the United States encompasses safety of transportation in the United States, including automobile accidents, airplane crashes, rail crashes, and other mass transit incidents, although the most fatalities are generated by road accidents.
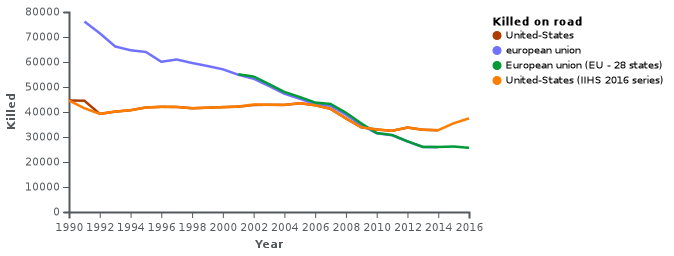
The U.S. government's National Center for Health Statistics reported 33,736 motor vehicle traffic deaths in 2014. This exceeded the number of firearm deaths, which was 33,599 in 2014.[1] According to another U.S. government office, the National Highway Traffic Safety Administration (NHTSA), motor vehicle crashes on U.S. roadways claimed 32,744 lives in 2014 and 35,092 in 2015.[2] (The National Center for Health Statistics may have different criteria for inclusion or a slightly different methodology from the National Highway Traffic Safety Administration.) The National Highway Traffic Safety Administration report comparing 2015 to 2014 said that fatalities increased from 2014 to 2015 in almost all categories: passenger vehicle occupants, passengers of large trucks, pedestrians, cyclists, motorcyclists, male and female, daytime and nighttime driving, and alcohol-impaired driving. Fatalities of drivers of large trucks remained unchanged. A NHTSA regression analysis of monthly roadway fatalities and various possible explanatory variables over the five-year period 2011–2015 showed the strongest correlation was with vehicle miles traveled (VMT), which had a correlation of .80, followed by average monthly temperature, which had a correlation of .74, meaning that higher temperatures were associated with increased fatalities.[3] Part of the reason for that pattern may be that more people are out walking and biking in the warmer months, and pedestrians and cyclists are often victims of collisions with motor vehicles. The report also suggests that there may be more vacation travel during warmer months. The report does not say if the analysis was based on annual vehicle miles traveled or monthly vehicle miles traveled. Although not mentioned, motorcycle use, and therefore motorcyclist fatalities, may also increase in warmer months.
The National Safety Council (NSC), a nonprofit safety advocacy group, estimates U.S. motor vehicle deaths in 2016 were 40,200, a 14% increase from its 2014 estimate. The NSC counts traffic and non-traffic deaths within one year of an accident while the U.S. government agencies count only traffic deaths occurring within 30 days of a crash. The NSC's statistics show that the increase in 2016 was due only in part to increased miles driven resulting from population growth, low fuel prices, and a strengthening economy. The NSC said the increase in deaths not explained by increased vehicle miles can be attributed to complacency about impaired driving and increased driver distraction.[4]
Motor vehicle deaths are most often expressed as a rate, often deaths per 100 million vehicle-miles or per billion vehicle-miles, or, for international comparisons, as deaths per billion vehicle-kilometers.
Introduction
In the United States, most fatalities are generated by road vehicles.
 |
 |
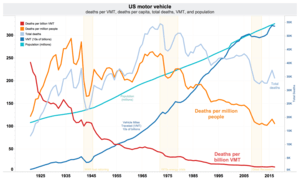
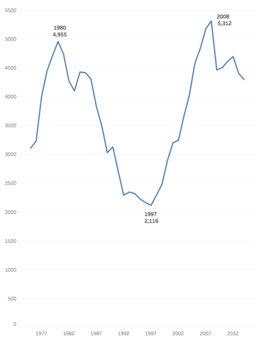
Safety overall has steadily improved in the United States for many decades. Between 1920 and 2000, the rate of fatal automobile accidents per vehicle-mile decreased by a factor of about 17.[9][10] Except for a pause during the youth bulge of the 1960s (a time when many young, inexperienced drivers were on the road), progress in reducing fatal accidents has been steady. Safety for other types of U.S. passenger transportation has also improved substantially, but long-term statistical data are not as readily available. While the fatality rate roughly leveled off around 2000–2005 at around 1.5 fatalities per 100 million miles traveled, it has resumed a downward trend and reached 1.27 in 2008.[9] The National Safety Council, using methodology that differs from the NHTSA, reports a rate (including deaths of pedestrians and cyclists killed in motor vehicle accidents) of 1.25 deaths per 100 million vehicle miles (or 12.5 deaths per billion vehicle miles) traveled in 2016.[11]
 | |
| |
Between 2008 and 2011, the economic recession, by a reduction in distance traveled, contributed to reducing fatalities.[5]
Traffic safety by mode by traveled distance
 |
 |
| * Source, left: caranddriver, US Department Of Transport[13] | * Source, right: Harry Mantakos.[14] |
Federal and individual approaches

The United States is exceptional in the way it approaches transportation safety.
While aviation is considered at a federal level with the FAA, road safety lacks a strong, federally led approach.[15] Road safety is considered by each of the states of the USA.
American attitudes regarding government surveillance and privacy, constitutionally guaranteed rights to confront one's accuser in criminal prosecutions, and skepticism towards government power might also have a role in concerns about transportation safety in the United States.[15]
Four basic traits identified by Tocqueville in the 1830s have some influence on transportation safety in the United States:[15]
- Individualism (personal and private initiative);
- Anti-statism (skepticism of government authority);
- Populism (wisdom and power of the common person); and
- Egalitarianism (equality of opportunity).
Automated camera technology might be used as in other nations to enforce traffic violations, but some argues that it violates the Constitution's Sixth Amendment, which provides that in “all criminal prosecutions, the accused shall enjoy the right … to be confronted with the witnesses against him.”.[15]
Some people in government want to say that safety is priority number one, but when the federal government provides some guidances for safety measure which would reduce death by 37%, such as alcohol in 1998 or motorcycle helmet in 1967, around ten years are necessary for such measures be implemented by a number of local governments.[15]
Federal organizations
Several federal organizations deal with transportation safety in the United States:[16]
- National Transportation Safety Board (NTSB)
- Highway safety in general and vehicle safety in particular is the responsibility of the DOT's National Highway Traffic Safety Administration (NHTSA).
- Design standards for safe highways are the responsibility of the Federal Highway Administration's Office of Roadway Safety.
- Safety standards for commercial motor carriers and motor vehicle operators are the responsibility of the Federal Motor Carrier Safety Administration (FMCSA).
- Railroad safety is the province of the Federal Railroad Administration's Office of Railroad Safety;
- Aviation safety is the responsibility of the Federal Aviation Administration (FAA);
- The Federal Transit Administration has assumed responsibility for federal oversight of transit agency safety.
- Pipeline safety is the responsibility of the Office of Pipeline Safety within the Pipeline and Hazardous Materials Safety Administration (PHMSA).
- Safe transportation of hazardous materials is the responsibility of the Office of Hazardous Materials within the Pipeline and Hazardous Materials Safety Administration.
- Marine safety is the responsibility of the U.S. Coast Guard within the Department of Homeland Security.
- Offshore pipeline safety is the responsibility of the Department of the Interior's Bureau of Safety and Environmental Enforcement.
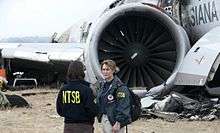
- Major accidents are investigated by an independent agency, the National Transportation Safety Board.
- Workplace safety, including the safety of transportation workers, is the responsibility of the Department of Labor's Occupational Safety and Health Administration.
- Hazardous waste is generally subject to regulation by PHMSA as a hazardous material, but is subject to additional regulation by the Environmental Protection Agency.
- The Nuclear Regulatory Commission sets standards for the design and manufacture of packages containing radioactive materials, while PHMSA regulates actual transport.
Local organizations
New York City started a program, Vision Zero, that aims to lower vehicular fatalities by 50% between 2014 and 2025.[17]
United States compared to other nations
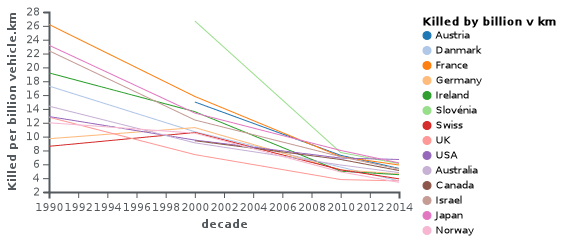
The fatality rate in the United States is high relative to most other high-income nations. The 2013 U.S. rate of 7.1 road fatalities per 1 billion vehicle-km is about double the 2013 rate in Sweden, which was 3.5 road fatalities per 1 billion vehicle-km. (See: List of countries by traffic-related death rate.)
This differences might be linked to a difference of approach in driving safety culture, for instance in the balance between liberty and mandatory or forbidden dangerous or unsafe behavior.[18]
To some extent this is due to geography and driver training, but more rigorous impaired driving enforcement and severe penalties in Sweden for driving under the influence may also explain the difference. While it might be argued that highways and vehicles in Sweden are different from those in the United States, the U.S. fatality rate is also about double the rate in the Canadian province of Ontario, which experienced 3.6 road fatalities per 1 billion vehicle-km according to preliminary 2014 data.[19] Ontario, which is a vast province of more than 1 million square kilometers, has a similar mix of highway types including congested urban and rural highways. Ontario also has a similar mix of large transport trucks essentially identical to U.S. transport trucks, full-sized pickup trucks, SUVs and passenger cars, although there may be more small cars driven in Ontario compared to the United States. This suggests that differences in fatality rates are due to non-physical factors such as driver behavior.
Comparing motorways (controlled-access, divided highways) in Europe and the United States, according to 2012 data, Denmark had the safest motorways with a rate of 0.72 road fatalities per 1 billion vehicle-km, while the United States had 3.38 road fatalities per 1 billion vehicle-km on its Interstate-type highways, often called freeways.[20] In Germany, where significant sections to the Autobahn network do not have mandatory speed limits, the death rate on such highways was 1.74 road fatalities per 1 billion vehicle-km, about half the U.S. rate for Interstate-type highways. (For chart, see: Safety: international comparison), when according to the German Road Safety Council (DVR) the number of deaths per kilometer of motorway is 30% lower when motorways have speed limit[21].
Another difference between the USA and Europe is that people in Europe believe higher speed limit have an adverse impact on safety: according to the Guardian an ETSC report from 2008 consider that «empirical evidence indicates that all instances' of introduced speed limits on German motorways have caused very large casualty reductions.»[22]. The ETSC takes into account the fact that if German motorways have same fatalities per kilometer indifferently of speed limit, traffic volumes on different sections are not the same[23].
Road safety compared to other nations
 | |
Safety compared to other nations by traveled distance
Traffic safety compared to other nations by traveled distance
| killed per miles, 2008 | Killed by billion trav km and per year (1990-2014) |
|---|---|
 |
 |
| * Source: caranddriver, US Department Of Transport[13] | * source OCDE.[29] |
Train safety compared to other nations by traveled distance
 |
 |
| Source: OECD, 2001-2006[30] | Source European Union Agency for Railways[31] Source of data: USA: Annual report FRA; Canada: Transport Safety Board; South Korea: KMMI; Australia: Annual report. In case of South Korea and Australia, the reference period is fiscal year, not calendar year. Passenger kilometres data for Canada and Japan taken from the oECD transport database |
Road safety
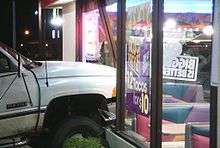
Car accidents are very common in the United States and the majority of these road crashes are caused by human error.
The target for the United States is to reduce fatalities rate at 1.02 fatalities per 100 million vehicles miles traveled in 2014.[32]
Fatality rates by state
The death rate per 100 million miles traveled in 2015 ranged from 0.52 in Massachusetts to 1.89 in South Carolina.[33] (The Massachusetts rate translates to about 3.25 fatalities per 1 billion vehicle-km. The South Carolina rate translates to about 11.8 fatalities per 1 billion vehicle-km.) In South Carolina, North Dakota and Texas, more than 40% of road fatalities were attributed to driving under the influence (DUI).[34] A plot of vehicle-miles traveled per capita vs fatalities per 100,000 population shows Montana, South Carolina and West Virginia as outliers with higher than expected fatalities.[35] Enforcement and compliance with seat belt laws varies by state. (Massachusetts, which had the lowest death rate per 100 million miles traveled in 2015, was among the states with the lowest use of seat belts.) Some states require motorcycle helmets while others do not. Speed limits, traffic density, topography, climate and many other factors affect the divergent accident rates by state. Speed limits in Texas, Utah, and Rhode Island are prima facie rather than absolute. This allows motorists in those states to defend against a speeding charge if it can be proven that the speed was reasonable and prudent. In good driving conditions, many drivers in prima facie states presume (usually correctly) that police will allow some tolerance in enforcement. Even in states with absolute speed limits, enforcement and penalties vary from one state to another. For these and other reasons, state-to-state comparisons are difficult. There are many studies examining increases in Interstate speed limits from 55 mph to 65, 70 and 75 mph. Some found that fatality rates increased significantly on Interstate highways where speed limits were raised.[36] One study that examined the change from 55 to 65 mph found higher Interstate speed limits improved overall highway safety by drawing traffic from less safe secondary highways to safer Interstate highways.[37] Since the changes to 80 mph speed limits in some states (and 85 mph on one section of a toll highway in Texas) are relatively recent, robust analysis is not yet available. Anecdotal evidence suggests actual vehicle speeds did not increase as much as speed limits did. Also, police may be enforcing the new higher limits more strictly than they enforced the prior limits. In some states, police have reallocated resources to focus more on impaired and distracted driving.[38] The higher speed limits are predominantly in rural states, which tend to be Republican states. To many Republican voters, speed limits (and seat belt laws) are seen as intrusions on personal liberty. According to transportation historian Owen Gutfreund, state governments may raise speed limits because raising the speed limit “sounds like such an easy regulatory win.” It's a simple way to “get government out of your face.”[38]
On the other hand, according to iihs, Farmer performed a new study comparing deaths per billion miles traveled by state and roadway type — between 1993 and 2013 — on rural roads (the study does not cover the urban roads) concluded that each 5 mph (8 km/h) increase in the maximum speed limit is related to a 4 percent fatalities increase on some roads and an 8 percent increase on interstates and freeways[39]. Anyway such effect and safer cars mitigate together[40].
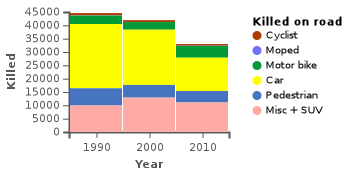
By class of road users
Class of road user involved in crash death vary from state to state. Anyway, in 2016, amongst many US states, Wyoming has a higher percentage of deaths involving occupants of SUVs and pickups, Massachusetts has highest proportions of car occupant deaths, District of Columbia has the highest percentage of motorcyclist deaths. The District of Columbia and New York have the highest percentage of pedestrian deaths.[41]
| Motor vehicle crash deaths by road user type, 2016 | |||
 | |||
| Source IIHS.[41] | |||
Although the number of motorcyclist death is lower than car's one, it is greater by traveled distance (miles or kilometers) [42].
 |
| * Source, NHTSA[43] |
Pedestrians and cyclists

As cars have become safer for occupants (due to airbags, structural crashworthiness and other improvements) the percent of pedestrian fatalities as a percent of total motor vehicle fatalities steadily increased from 11% in 2004[44] to 15% in 2014 according to NHTSA data.[45] Bicyclists accounted for 2 percent of all traffic deaths in 2014.[46]
| Pedestrians killed in 2014, in %, by light level | |||
 | |||
| Source GHSA (based on Analysis Reporting System (FARS) as published by the National Highway Traffic Safety )[47] | |||
| Killed US pedestrian per million | |
|---|---|
 | |
| Source GHSA.[47] | |
Rates per driver's license
One can also calculate auto fatalities per driver's license. From 1990 to 2009, this number has also been improving: from 1 death per 3,745 driver's licenses in 1990 to 1 per 6,200 driver's licenses in 2009.[48] Crowded, traffic-choked Northeastern cities including Washington, D.C., Baltimore, Boston, Providence, Philadelphia, Newark, Hartford, New Haven, Springfield and Worcester, Massachusetts, were most likely to have car accidents.[49] The NHTSA through its Fatality Analysis Reporting System stated that auto fatalities continue to be the leading cause of death for young adults.[50]
Risk factors

Rural non-Interstate highways are particularly risky. Most are two-lane non-divided highways built to lower standards than Interstate highways. Drivers are more likely to be drunk or not wearing seat belts. Speeding is common. Deer, elk and moose crossing the highway add to the risk compared to urban highways. In the event of an accident in a remote area, injured victims may not receive emergency medical care in time to save their lives.[51]
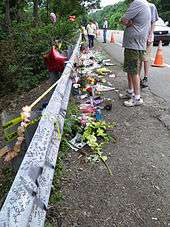
Many accidents when driving personal vehicles are caused by distracted driving. According to the American Automobile Association (AAA), distraction plays a factor in 60% of moderate to serious teen car crashes. Specifically, passenger and cell phone interaction accounted for 27% of crashes, the leading cause. Drivers looking away from the target (roadway) also accounted for 19%.[52]
Non-use of seat belts is a significant risk factor. According to Col. Tom Butler, chief of the Montana Highway Patrol, preliminary 2015 data indicated that 178 of the 224 vehicle occupant fatalities were of individuals not wearing seat belts.[53] The fine in Montana for not wearing a seat belt in 2015 was $20. Although speed limits increased from 75 mph to 80 mph on rural interstates that year, the biggest statewide increase in both crashes and deaths occurred on secondary roads. Forty-three people died on Montana two-lane roads outside of towns that are neither U.S. or state highways.[53]
Average trip duration may be greater in rural states, which may mean driver fatigue is a more salient risk factor in rural states than in more densely populated states. Most data on the number of hours driven in a day and accident rates is for commercial drivers who are required to keep driving logs. (See next section.)
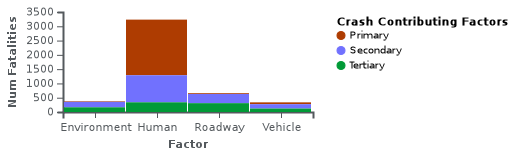
Human factor is one of the more significant in various factors leading to fatalities.[54]
| Crash Contributing Factors in Florida (1998-2000) | |
|---|---|
| Primary and Secondary Crash Contributing Factors | Human factor |
 |
 |
| Source FDOT[54] | |
According to FDOT:
- «When speeding is compared to fault, drivers traveling at any speed over 4 MPH over the posted limit were highly overrepresented in fault. As the amount of speeding increases, the degree of overrepresentation increases; however, even at 5-9 miles over the limit, drivers were overrepresented in fault by a factor of over 2.0. ».
- «drinking drivers were between 3.5 and 18 times as likely to be at fault in the crash, depending on the amount of alcohol ingested. »
| Alcohol and Speed Over representation on faults in Florida (1998-2000) | |
|---|---|
| Alcohol influence | Speed influence |
 |
 |
| ORF for Over representation factor compares the rate of fault for a specific characteristic against the rate of fault for those without this characteristic. ORF greater than 1 means the risk is greater. ORF equal to one means the risk is not changed. When few data is available confidence interval is not accurate.
For instance, a speed excess between 5 and 9 mph multiply the risk of fault by two. | |
| Source FDOT[54] | |
Cause
Several causes are involved:[55]
- Distracted driving
- Drunk driving
- Speeding
- Reckless driving
- Rain
- Running red lights (traffic light)
- Night driving
- Design defects
- Tailgating
- Wrong-way driving or improper turns
- Teenage drivers
- Drugs
- Potholes
- Tire blowouts
- Animal crossings (deer–vehicle collisions)
- Construction sites
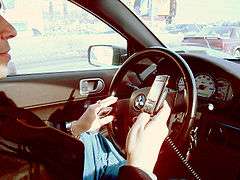 Distracted driving, a chief concern with mobile phone usage.
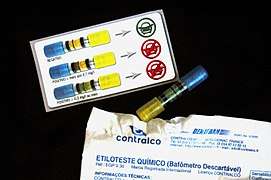 single usage Éthylotest
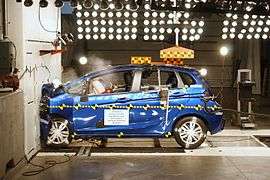 2016 Honda Fit striking a wall head-on at 56 km/h.
.jpg) Driving in the rain
Driving in the rain Roadkilled deer on the Okatie Highway, South Carolina, USA
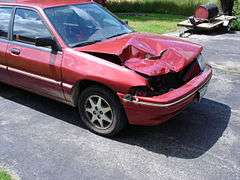 A car after colliding with a white-tailed deer in Wisconsin
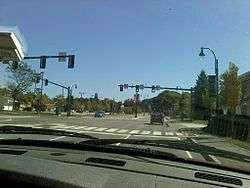 A traffic light in Westbrook, Maine. Notice the red arrow to the left of the two green straight lights.
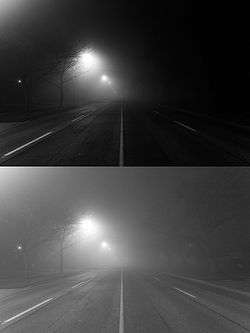 By night. Top: human; bottom: wider view
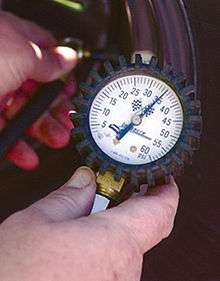 Tire pressure gauge
VMT
It is sometimes understood that fatalities increase with the increase of VMT, but this is not systematic as fatalities might remain quite stable while the VMT change.
| USA | Minnesota |
|---|---|
 |
 |
| Between 1994 and 2007, VMT increased by 28% while fatalities remains stable (6%) variation Between 2007 and 2009, VMT decreased by 2% while fatalities decreased by 20% |
Between 1961 and 1968, VMT increased by 32%, while fatalities increased by 45%, Between 1968 and 1982, VMT increased by 50%, while fatalities decreased by 50%, |
| * Source NHTSA.[56] | * Source Minnesota[57] |
Modal comparison
Driving versus flying
The number of deaths per passenger-mile on commercial airlines in the United States between 2000 and 2010 was about 0.2 deaths per 10 billion passenger-miles,[58][59] while for driving, the rate was 1.5 per 100 million vehicle-miles for 2000, which is 150 deaths per 10 billion miles for comparison with the air travel rate.[9][60][61][62]
The greatest risk in flying is in takeoff and landing, meaning that longer aircraft trips are safer per mile. Commuter planes used on shorter flights have higher risk than larger jet aircraft. Driving on U.S. Interstate highways, which are almost always controlled-access divided highways, is safer than driving on most other roads and highways.
Unlike the large U.S. air carriers and commuter airlines, which on average have less than 20 fatalities annually, each year general aviation fatalities number in the hundreds. Most general aviation accidents involve single-engine, piston-powered airplanes used in recreational aviation.[63]
Aviation vs rail

 | |
Rail and bus
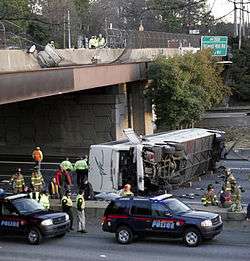
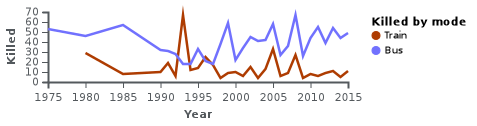
Rail and bus (motorcoach) accidents also account for fatalities, although public transportation is far less dangerous than driving a personal vehicle.
From 2014 to 2016, fatal rail fatalities were 227, 234 and 231;[67] with trespassers, fatalities are 749 for 2016.[68]
 | |
Transportation jobs: Commercial drivers and air pilots
Source: Federal Motor Carrier Safety Administration[69]
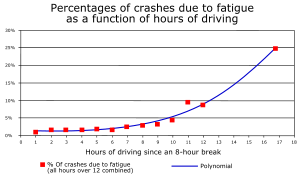
Driver fatigue is a concern, particularly for commercial drivers. Hours of service regulations are issued by the Federal Motor Carrier Safety Administration (FMCSA) and govern the working hours of anyone operating a commercial motor vehicle (CMV) in the United States. The relationship between number of hours driven and the percent of commercial truck crashes related to driver fatigue is an exponential relationship. (See graph.)
Although the accident rate per 100 million miles for professional truckers is low, the high number of miles driven by a truck driver makes truck driving a risky occupation. Trucking transportation occupations accounted for one quarter of all work-related fatalities in 2015, more than any other U.S. job, according to the U.S. Labor Department's Bureau of Labor Statistics' annual workplace fatality report.[70] The fatal injury rate in 2015 was 14.7 per 100,000 full-time equivalent workers in transportation and material moving occupations (which includes both truckers and air transportation workers.)[71] This was a significantly lower rate than for workers in farming, fishing, and forestry occupations, but high compared to most other occupation categories. The report did not break out the fatal injury rate per 100,000 full-time equivalent workers among aircraft pilots and flight engineers but did note that they had a high fatal injury rate compared to all workers. There were 57 fatalities among aircraft pilots and flight engineers in 2015.[72]
Safety by state
| US mortality by state per million inhabitant in 2013 | |
|---|---|
 | |
| |
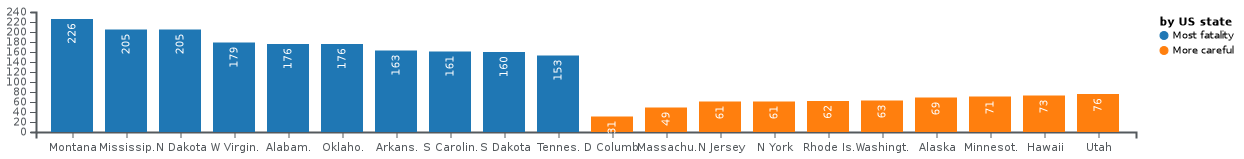
Between 2006 and 2015, number of killed people changed from 42642 to 35092 (−17%). During this period, around half of the states reduced the number of death by more than 20%, for instance: Alabama, Arizona, Arkansas, California, District of Columbia, Hawaii, Illinois, Iowa, Kansas, Louisiana, Maryland, Massachusetts, Mississippi, Nevada, New Jersey, New Mexico, New York, Oklahoma, Pennsylvania, Rhode Island, South Dakota, Tennessee, Vermont, Virginia, West Virginia, Wisconsin, Wyoming.
In the same time, some states have killed more people, for instance North Dakota and Texas.
Road safety states trends
| US fatalities by state | |
|---|---|
 |
 |
Texas annual report 2015,[76] NHTSA,[77] COMPARATIVE ANALYSIS OF FATAL CRASHES IN TEXAS VS. CALIFORNIA AND IMPLICATIONS FOR TRAFFIC SAFETY IN TEXAS[78] | |
See also
Notes
- ↑ "FastStats Homepage - Injuries". Centers for Disease Control and Prevention - National Center for Health Statistics. Retrieved March 14, 2017.
- ↑ "2015 Motor Vehicle Crashes: Overview". National Highway Traffic Safety Administration. Retrieved March 14, 2017.
- ↑ "2015 Motor Vehicle Crashes: Overview". National Highway Traffic Safety Administration. p. 10. Retrieved March 14, 2017.
- ↑ Beene, Ryan (February 15, 2017). "Deaths on U.S. Roads Reach Highest Since 2007 Amid More Driving". Bloomberg. Retrieved March 14, 2017.
- 1 2 https://www.ntsb.gov/investigations/data/Pages/Data_Stats.aspx
- ↑ https://www.ntsb.gov/investigations/data/Documents/TransportationFatalites_2014_2015.pdf
- ↑ https://www.ntsb.gov/news/press-releases/Pages/PR20150202.aspx
- ↑ "Transportation Safety by the Numbers - Bureau of Transportation Statistics". www.rita.DOT.gov. Retrieved July 16, 2017.
- 1 2 3 "Fatality Analysis Reporting System". U.S. National Highway Traffic Safety Administration.
- ↑ "Making Sense of Highway Data". U.S. National Motorists Association. Retrieved 22 December 2016.
- ↑ Gorzelany, Jim (February 16, 2017). "Death Race 2017: Where To Find The Most Dangerous Roads In America". Forbes. Retrieved March 13, 2017.
- ↑ "Road Safety Annual Report, Books / Road Safety Annual Report / 2016" (PDF). www.OECD-ilibrary.org. Retrieved July 16, 2017.
- 1 2 "Safety in Numbers: Charting Traffic-Safety and Fatality Data - Feature". CarAndDriver.com. Retrieved July 16, 2017.
- ↑ "Safety vs Driving". www.Meretrix.com. Retrieved July 16, 2017.
- 1 2 3 4 5 L. Gifford, Jonathan (July 1, 2010). "ICT and road transportation safety in the United States: a case of "American exceptionalism"". IATSS Research. 34 (1): 1–8. doi:10.1016/j.iatssr.2010.06.006. Retrieved July 16, 2017 – via ScienceDirect.
- ↑ "Transportation Safety Regulation in the United States Government". Transportation.gov. April 15, 2016. Retrieved July 16, 2017.
- ↑ Lisa, Belkin (January 14, 2015). "'Vision Zero,' one year on: NYC's quest to reduce preventable traffic deaths". Yahoo News. Retrieved July 17, 2015.
- ↑ Millward, David. "Why US roads are more dangerous than European ones". Telegraph.co.uk. Retrieved July 16, 2017.
- ↑ "Canadian Motor Vehicle Traffic Collision Statistics" (PDF). Transport Canada (Government of Canada). Retrieved March 14, 2017.
- ↑ "International Traffic and Accident Data: Selected Risk Values for the Year 2012" (PDF). Bundesanstalt für Straßenwesen (Federal Highway Research Institute). Bundesanstalt für Straßenwesen. December 2012. Retrieved November 8, 2015.
- ↑ http://etsc.eu/wp-content/uploads/2015-03-pin-flash-report-28.pdf
- ↑ https://www.theguardian.com/news/datablog/2013/may/13/speed-limits-reduce-number-road-deaths
- ↑ https://www.theguardian.com/news/datablog/2013/may/13/speed-limits-reduce-number-road-deaths
- ↑ SÉCURITÉ ROUTIÈRE: Quelle est la situation dans votre pays? ec.europa.eu/transport/road_safety/pdf/statistics/dacota/scoreboard_2015_en.pdf D'après des données CARE/Eurostat
- ↑ Base de donénes IRTAD_CASUAL_BY_AGE stats.oecd.org/Index.aspx?DataSetCode=IRTAD_CASUAL_BY_AGE
- ↑ http://etsc.eu/11th-annual-road-safety-performance-index-pin-report-2/
- ↑ http://etsc.eu/wp-content/uploads/11-PIN-annual-report-background-tables.xlsx
- ↑ http://www.iihs.org/iihs/topics/t/general-statistics/fatalityfacts/overview-of-fatality-facts/2016
- ↑ Road Safety Annual Report 2016 ITF ITSDAG
- ↑ "La Sécurité et la réforme du cadre réglementaire des chemins de fer - OECD READ edition". OECD iLibrary. Retrieved July 16, 2017.
- ↑ http://www.era.europa.eu/Document-Register/Documents/Railway%20Safety%20Performance%202016%20final%20E.pdf
- ↑ Road Safety Annual Report 2014 Couverture International Transport Forum OECD Publishing, 2 oct. 2014 - 450 pages
- ↑ "General statistics: Crashes took 35,092 lives in the U.S. in 2015". Insurance Institute for Highway Safety, Highway Loss Data Institute. Retrieved March 13, 2017.
- ↑ "Compare Traffic Deaths by State". Find the Data. Retrieved March 13, 2017.
- ↑ Jed Kolko [@JedKolko] (15 October 2015). "Also, more miles driven per capita = more car deaths per capita. The state of Colorado reached their highest number in traffic fatalities in a decade. According to the Colorado Department of Transportation (CDOT) safety crash data, there were 608 fatal crashes last year alone; rising 11% compared to 2016, and 24% compared to 2014. (CDOT, 2017) there were 608 fatal crashes in the year of 2017. There are steps that the states can all take to lead towards better road safety such as access control points at on-ramps to the freeways, a law in place that motorcyclists are required to wear a helmet while riding, and to widen highways that are congested and most frequently used by drivers. There are already hundreds of laws put in place for the individual driver to follow such as always wearing a seatbelt or no texting/calling while driving, leaving the department of transportation in charge of moving forward with safety features throughout the busy highways. (correlation=0.8). @Richard_Florida @CityLab" (Tweet) – via Twitter. line feed character in
|title=at position 67 (help) - ↑ Frisman, Paul (January 18, 2013). "Speed limit increases and accident rates". National Cooperative Highway Research Program.
The NCHRP study found that higher speed limits were associated with an increased likelihood of deaths and incapacitating injuries. It found that increasing a speed limit from 55 to 65 mph on an "average" section of high speed road resulted in about a 3% increase in the total number of crashes and a 24% increase in the likelihood that a vehicle occupant would be fatally injured. This increased crash rate would yield a 28% increase in the number of fatalities following the speed limit increase. The study also found a similar, but lesser, impact when speed limits were raised from 65 to 75 mph. In those cases, the total number of crashes increased by 0.64%, increasing the probability of a fatality by 12%, with an overall increase of 13% in total fatalities. Although the analysis did not explain why a smaller increase occurred at the higher speeds, the study suggested that people may drive more cautiously when driving faster, or that roads deemed appropriate for a 75 mph limit are safer.
- ↑ Lave, Charles (1995). "Higher Speed Limits May Save Lives". AccessMagazine.org. The University of California Transportation Center.
the new 65 mph speed limit freed highway patrols to shift resources from speed enforcement on the Interstates to other safety activities and to other highways. It also reallocated traffic by making the safer Interstate Highways more attractive.
- 1 2 Marshall, Aarian (May 4, 2016). "Raising Speed Limits Is Irresponsible, But States Keep Doing It". Wired.
- ↑ http://www.iihs.org/externaldata/srdata/docs/sr5104.pdf
- ↑ http://www.iihs.org/iihs/news/desktopnews/speed-limit-increases-cause-33-000-deaths-in-20-years
- 1 2 http://www.iihs.org/iihs/topics/t/general-statistics/fatalityfacts/state-by-state-overview
- ↑ https://crashstats.nhtsa.dot.gov/Api/Public/ViewPublication/810620
- ↑ NHTSA National Center for Statistics and Analysis, Traffic Safety Facts 2005 Data DOT HS 810 620, US National Highway Traffic Safety Administration
- ↑ "Traffic Safety Facts - Pedestrians (2013 Data)". NHTSA. Retrieved March 13, 2017.
- ↑ "Traffic Safety Facts - Pedestrians (2014 Data)". NHTSA. Retrieved March 13, 2017.
- ↑ "Bicyclists". NHTSA. Retrieved March 13, 2017.
- 1 2 http://www.ghsa.org/sites/default/files/2016-11/spotlight_ped2015.pdf
- ↑ "Table 1105. Fatal Motor Vehicle Accidents—National Summary: 1990 to 2009". U.S. Census Bureau. Retrieved December 22, 2016.
- ↑ Doyle, Rice (November 11, 2014). "Northeastern Cities Have the Most Car Accidents". USA Today. Retrieved May 12, 2015.
- ↑ "NHTSA Data Confirms Traffic Fatalities Increased In 2012". U.S. Department of Transportation. National Highway Traffic Safety Administration. November 14, 2013. Retrieved December 22, 2016.
- ↑ Berkes, Howard (November 29, 2009). "The Deadliest Roads Are Rural". National Public Radio. Retrieved March 13, 2017.
- ↑ Manookian, Brian. "Statistical Risks Of Driving And Related Acts". Cummings Manookian. Retrieved December 22, 2016.
- 1 2 Briggeman, Kim (January 4, 2016). "Montana highway death toll up sharply in 2015". missoulian.com. Missoulian.
- 1 2 3 http://www.fdot.gov/research/completed_proj/summary_sf/fdot_bd050_rpt.pdf
- ↑ King, Laiza (August 31, 2016). "Top 15 Causes Of Car Accidents And How You Can Prevent Them". HuffingtonPost.com. Retrieved July 16, 2017.
- ↑ https://www-fars.nhtsa.dot.gov/Main/index.aspx
- ↑ https://dps.mn.gov/divisions/ots/reports-statistics/Documents/2014-crash-facts.pdf
- ↑ "Fatalities Bureau of Transportation Statistics".
- ↑ "Passenger miles Bureau of Transportation Statistics".
- ↑ "Aviation".
- ↑ Arnold Barnett (1991). "It's Safer to Fly". Risk Analysis. 11 (1): 13–14. doi:10.1111/j.1539-6924.1991.tb00558.x.
- ↑ Peter B. Ladkin (1997). "To Drive or To Fly". University of Bielefeld.
- ↑ "Bureau of Transportation Statistics annual report". 2015.
- 1 2 "General Aviation Profile - Bureau of Transportation Statistics". www.BTS.gov. Retrieved July 16, 2017.
- 1 2 "RITA - BTS - Figure 1: Aviation Fatalities: 2001-2011". apps.BTS.gov. Retrieved July 16, 2017.
- 1 2 "Table 2-1: Transportation Fatalities by Mode - Bureau of Transportation Statistics". www.BTS.gov. Retrieved July 16, 2017.
- ↑ http://safetydata.fra.dot.gov/officeofsafety/publicsite/summary.aspx
- ↑ "4.08 - Casualty Summary Tables". safetydata.FRA.dot.gov. Retrieved July 16, 2017.
- ↑ "Regulatory Impact and Small Business Analysis for Hours of Service Options". Federal Motor Carrier Safety Administration. Archived from the original on October 31, 2012. Retrieved February 22, 2008.
- ↑ Rafter, Michelle (December 19, 2016). "Driving a Truck is Among Deadliest Jobs in the U.S." Trucks.com. Retrieved March 13, 2017.
- ↑ "Census of Fatal Occupational Injuries Summary, 2015, Table 3". U.S. Department of Labor, Bureau of Labor Statistics. Retrieved March 13, 2017.
- ↑ "Census of Fatal Occupational Injuries Summary, 2015". U.S. Department of Labor, Bureau of Labor Statistics. Retrieved March 13, 2017.
- ↑ "The Geography of Car Deaths in America". CityLab.com. October 2015. Retrieved July 16, 2017.
- ↑ https://www.dot.nd.gov/divisions/safety/docs/dot-male-driver-report-final.pdf
- ↑ https://www.dot.nd.gov/divisions/safety/docs/crash-summary.pdf
- ↑ TEXAS HIGHWAY SAFETY ANNUAL REPORT FISCAL YEAR 2015 Developed and Prepared by: The Staff of the Traffic Safety Section TxDOT Traffic Operations Division 125 E. 11th Street Austin, Texas 78701-2483 (512) 416-3200 12/31/2015
- ↑ https://crashstats.nhtsa.dot.gov/Api/Public/ViewPublication/812185
- ↑ http://ftp.dot.state.tx.us/pub/txdot-info/trf/trafficsafety/engineering/comparative-analysis.pdf
- ↑ http://ftp.dot.state.tx.us/pub/txdot-info/trf/crash_statistics/2016/a.pdf
- ↑ "General statistics". IIHS.org. Retrieved July 16, 2017.
References
- Badger, Emily; Ingraham, Christopher (October 1, 2015), "The hidden inequality of who dies in car crashes", The Washington Post