Talacogon, Agusan del Sur
| Talacogon | |
|---|---|
| Municipality | |
| Municipality of Talacogon | |
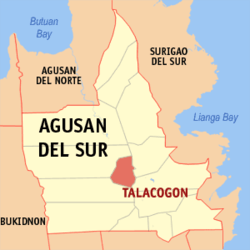 Map of Agusan del Sur with Talacogon highlighted | |
.svg.png) Talacogon Location within the Philippines | |
| Coordinates: 8°27′N 125°47′E / 8.45°N 125.79°ECoordinates: 8°27′N 125°47′E / 8.45°N 125.79°E | |
| Country |
|
| Region | Caraga (Region XIII) |
| Province | Agusan del Sur |
| District | 1st District |
| Barangays | 16 (see Barangays) |
| Government [1] | |
| • Type | Sangguniang Bayan |
| • Mayor | Jesryl E. Masendo |
| • Electorate | 20,439 voters (2016) |
| Area [2] | |
| • Total | 405.25 km2 (156.47 sq mi) |
| Population (2015 census)[3] | |
| • Total | 38,374 |
| • Density | 95/km2 (250/sq mi) |
| Time zone | UTC+8 (PST) |
| ZIP code | 8510 |
| PSGC | 160311000 |
| IDD : area code | +63 (0)85 |
| Climate type | Tropical rainforest climate |
| Income class | 2nd municipal income class |
| Revenue (₱) | 145,433,666.50 (2016) |
| Native languages |
Agusan language Butuanon Higaonon Tagalog |
| Website |
www |
Talacogon, officially the Municipality of Talacogon, (Cebuano: Lungsod sa Talacogon; Tagalog: Bayan ng Talacogon), is a 2nd class municipality in the province of Agusan del Sur, Philippines. According to the 2015 census, it has a population of 38,374 people.[3]
Geography
Talacogon is located at 8°27′N 125°47′E / 8.45°N 125.79°E.
According to the Philippine Statistics Authority, the municipality has a land area of 405.25 square kilometres (156.47 sq mi) [2] constituting 4.06% of the 9,989.52-square-kilometre- (3,856.98 sq mi) total area of Agusan del Sur.
Barangays
Talacogon is politically subdivided into 16 barangays.[4]
| PSGC | Barangay | Population | ±% p.a. | |||
|---|---|---|---|---|---|---|
| 2015[3] | 2010[5] | |||||
| 160311017 | Batucan | 5.7% | 2,181 | 1,897 | 2.69% | |
| 160311001 | BuenaGracia | 4.8% | 1,846 | 1,657 | 2.08% | |
| 160311002 | Causwagan | 8.0% | 3,055 | 3,287 | −1.38% | |
| 160311004 | Culi | 1.3% | 511 | 585 | −2.54% | |
| 160311005 | Del Monte | 20.2% | 7,750 | 7,167 | 1.50% | |
| 160311006 | Desamparados | 3.5% | 1,361 | 1,498 | −1.81% | |
| 160311014 | La Flora | 3.2% | 1,212 | 1,003 | 3.67% | |
| 160311007 | Labnig | 7.5% | 2,888 | 2,907 | −0.12% | |
| 160311015 | Maharlika | 2.2% | 855 | 874 | −0.42% | |
| 160311016 | Marbon | 4.1% | 1,570 | 1,658 | −1.03% | |
| 160311008 | Sabang Gibung | 2.5% | 961 | 1,023 | −1.18% | |
| 160311009 | San Agustin (Poblacion) | 11.2% | 4,314 | 3,948 | 1.70% | |
| 160311010 | San Isidro (Poblacion) | 2.3% | 897 | 1,114 | −4.04% | |
| 160311011 | San Nicolas (Poblacion) | 6.0% | 2,307 | 2,519 | −1.66% | |
| 160311012 | Zamora | 3.7% | 1,411 | 1,233 | 2.60% | |
| 160311013 | Zillovia | 13.7% | 5,255 | 4,854 | 1.52% | |
| Total | 38,374 | 37,224 | 0.58% | |||
Demographics
| Population census of Talacogon | ||
|---|---|---|
| Year | Pop. | ±% p.a. |
| 1903 | 2,811 | — |
| 1918 | 2,201 | −1.62% |
| 1939 | 3,242 | +1.86% |
| 1948 | 3,186 | −0.19% |
| 1960 | 4,861 | +3.58% |
| 1970 | 7,719 | +4.73% |
| 1975 | 9,110 | +3.38% |
| 1980 | 11,452 | +4.68% |
| 1990 | 21,655 | +6.58% |
| 1995 | 36,946 | +10.53% |
| 2000 | 41,696 | +2.63% |
| 2007 | 33,093 | −3.14% |
| 2010 | 37,224 | +4.37% |
| 2015 | 38,374 | +0.58% |
| Source: Philippine Statistics Authority[3][5][6][7] | ||
In the 2015 census, Talacogon had a population of 38,374.[3] The population density was 95 inhabitants per square kilometre (250/sq mi).
References
- ↑ "Municipality". Quezon City, Philippines: Department of the Interior and Local Government. Retrieved 31 May 2013.
- 1 2 "Province: Agusan del Sur". PSGC Interactive. Quezon City, Philippines: Philippine Statistics Authority. Retrieved 12 November 2016.
- 1 2 3 4 5 Census of Population (2015). "Caraga". Total Population by Province, City, Municipality and Barangay. PSA. Retrieved 20 June 2016.
- ↑ "Municipal: Talacogon, Agusan del Sur". PSGC Interactive. Quezon City, Philippines: Philippine Statistics Authority. Retrieved 8 January 2016.
- 1 2 Census of Population and Housing (2010). "Caraga". Total Population by Province, City, Municipality and Barangay. NSO. Retrieved 29 June 2016.
- ↑ Censuses of Population (1903–2007). "Caraga". Table 1. Population Enumerated in Various Censuses by Province/Highly Urbanized City: 1903 to 2007. NSO.
- ↑ "Province of Agusan del Sur". Municipality Population Data. Local Water Utilities Administration Research Division. Retrieved 17 December 2016.
Places adjacent to Talacogon, Agusan del Sur | ||||||||||
|---|---|---|---|---|---|---|---|---|---|---|
| ||||||||||
Prosperidad (capital) | |
| Component city | |
| Municipalities | |
This article is issued from
Wikipedia.
The text is licensed under Creative Commons - Attribution - Sharealike.
Additional terms may apply for the media files.