Support and resistance
In stock market technical analysis, support and resistance are certain predetermined levels of the price of a security at which it is thought that the price will tend to stop and reverse.[1] These levels are denoted by multiple touches of price without a breakthrough of the level.
Support versus resistance
A support level is a level where the price tends to find support as it falls. This means that the price is more likely to "bounce" off this level rather than break through it. However, once the price has breached this level, by an amount exceeding some noise, it is likely to continue falling until meeting another support level.[2]
A resistance level is the opposite of a support level. It is where the price tends to find resistance as it rises. Again, this means that the price is more likely to "bounce" off this level rather than break through it. However, once the price has breached this level, by an amount exceeding some noise, it is likely to continue rising until meeting another resistance level.
Reactive versus proactive support and resistance
Proactive support and resistance methods are "predictive" in that they often outline areas where price has not actually been.[3] They are based upon current price action that, through analysis, has been shown to be predictive of future price action. Proactive support and resistance methods include Measured Moves, Swing Ratio Projection/Confluence (Static (Square of Nine), Dynamic (Fibonacci)), Calculated Pivots, Volatility Based, Trendlines and Moving averages, VWAP, Market Profile (VAH, VAL and POC).[3]
Reactive support and resistance are the opposite: they are formed directly as a result of price action or volume behaviour. They include Volume Profile, Price Swing lows/highs, Initial Balance, Open Gaps, certain Candle Patterns (e.g. Engulfing, Tweezers) and OHLC.[3]
A price histogram is useful in showing at what price a market has spent more relative time. Psychological levels near round numbers often serve as support and resistance.[3]
Identifying support and resistance levels
Support and resistance levels can be identified by trend lines (technical analysis).[4] Some traders believe in using pivot point calculations.[5]
The more often a support/resistance level is "tested" (touched and bounced off by price), the more significance is given to that specific level.[6]
If a price breaks past a support level, that support level often becomes a new resistance level. The opposite is true as well; if price breaks a resistance level, it will often find support at that level in the future.[7]
Psychological Support and Resistance levels form an important part of a trader's technical analysis.[8] As price reaches a value ending in 50 (ex. 1.2050) or 00 (ex. 1.3000), people often see these levels as a strong potential for interruption in the current movement. The price may hit the line and reverse, it could hover around the level as Bulls and Bears fought for supremacy, or it may punch straight through. A trader should always exercise caution when approaching 00 levels in general, and 50 levels if it has previously acted as Support or Resistance.
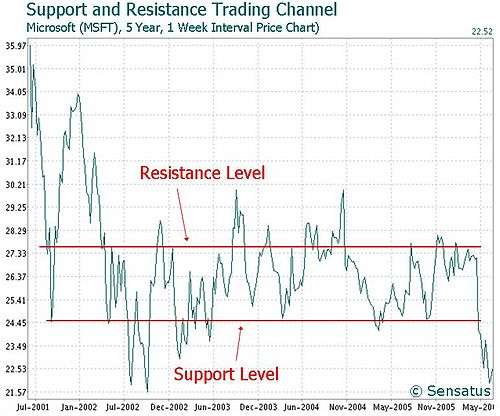
Using support and resistance levels
This is an example of support switching roles with resistance, and vice versa:
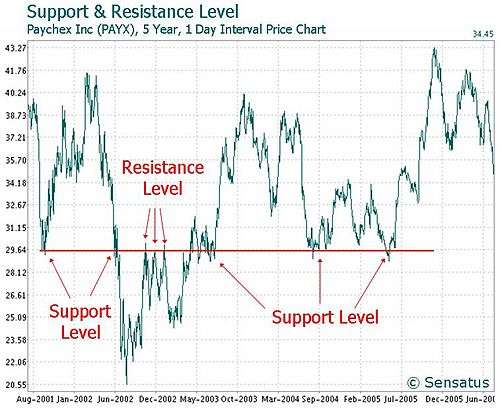
If a stock price is moving between support and resistance levels, then a basic investment strategy commonly used by traders, is to buy a stock at support and sell at resistance, then short at resistance and cover the short at support[9] as per the following example:
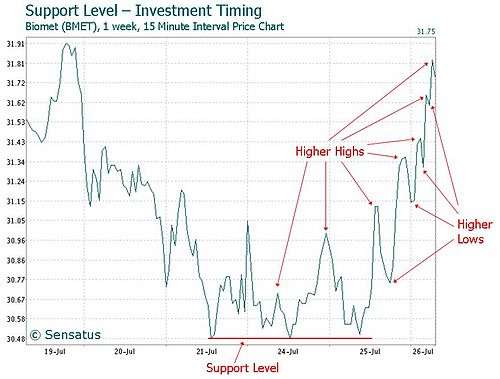
When judging entry and exit investment timing using support or resistance levels, it is important to choose a chart based on a price interval period that aligns with your trading strategy timeframe. Short term traders tend to use charts based on interval periods, such as 1 minute (i.e. the price of the security is plotted on the chart every 1 minute). Longer term traders typically use price charts based on hourly, daily, weekly or monthly interval periods. Typically traders use shorter term interval charts when making a final decisions on when to invest, such as the following example based on 1 week of historical data with price plotted every 15 minutes. In this example, the early signs that the stock was coming out of a downtrend was when it started to form support at $30.48 and then started to form higher highs and higher lows. This signals a change from negative to positive trending.
See also
References
- ↑ Amiri, M.; Zandieh, M.; Vahdani, B.; Soltani, R.; Roshanaei, V. (January 2010). "An integrated eigenvector–DEA–TOPSIS methodology for portfolio risk evaluation in the FOREX spot market". Expert Systems with Applications. 37 (1): 509–516. doi:10.1016/j.eswa.2009.05.041. Retrieved 13 August 2015.
- ↑ McLeod, Gregory (21 January 2014). "Forex Support and Resistance Explained". Daily FX. Retrieved 13 August 2015.
- 1 2 3 4 Schlossberg, Boris (2006). Technical Analysis of the Currency Market: Classic Techniques for Profiting from Market Swings and Trader Sentiment. John Wiley & Sons. ISBN 9780471973065.
- ↑ "A Guide To Correctly Drawing Support and Resistance Levels Accurately". The Forex Guy. Retrieved 13 August 2015.
- ↑ "Identify support and resistance on a chart". FX Street. Retrieved 13 August 2015.
- ↑ "Support and Resistance Levels". Investors Underground. Day Trading Encyclopedia. Retrieved 29 June 2016.
- ↑ Thomsett, Michael C. "Support and resistance simplified". Google Scholar. Retrieved 13 August 2015.
- ↑ Stanley, James. "The Hidden Patterns of Support and Resistance in the Forex Market". Yahoo! Finance. Retrieved 13 August 2015.
- ↑ Chapman-Blench, Neil F (2012). Traderevolution: Training for Traders. AuthorHouse. ISBN 9781477215555.
External links
- John Murphy, Technical Analysis of the Financial Markets, ISBN 978-0-7352-0066-1
- Stephen Petrivy, xBinOp.com (2016). Technical Analysis – Supports and Resistances.