Solar minimum
Solar minimum is the period of least solar activity in the 11 year solar cycle of the sun. During this time, sunspot and solar flare activity diminishes, and often does not occur for days at a time. The date of the minimum is described by a smoothed average over 12 months of sunspot activity, so identifying the date of the solar minimum usually can only happen 6 months after the minimum takes place. Solar minima are not generally correlated with changes in climate but recent studies have shown a correlation with regional weather patterns.
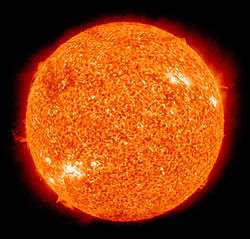
Solar minimum is contrasted with the solar maximum, where there may be hundreds of sunspots.
Solar minimum and solar maximum
Solar minima and maxima are the two extremes of the sun's 11-year activity cycle.[1] At a maximum, the sun is peppered with sunspots, solar flares erupt, and the sun hurls billion-ton clouds of electrified gas into space. It's a good time for sky watchers who enjoy auroras, but not so good for astronauts who have to be wary of radiation storms. Power outages, satellite malfunction and communication disruptions, and GPS receiver malfunctions are just a few of the things that can happen during a solar maximum.[2]
At a solar minimum, there are fewer sunspots and solar flares subside. Sometimes, days or weeks go by without a spot. It is a safer time to travel through space, but a less interesting time to watch polar skies.
Predicting solar minimum cycles
Their non-linear character makes predictions of solar activity very difficult.[3] The solar minimum is characterized by a period of decreased solar activity with few, if any, sunspots. The accompanying decrease in solar radiation makes it the safest time for astronauts to carry out space missions. Three NASA scientists were better able to predict solar cycles (solar minima and solar maxima) using a simple function with four parameters,[4] which then led the ability to discover the duration of these solar cycles. Scientists from the National Center for Atmospheric Research (NCAR) also developed a computer model of solar dynamics (Solar dynamo) for more accurate predictions and have confidence in the forecast based upon a series of test runs with the newly developed model simulating the strength of the past eight solar cycles with more than 98% accuracy.[5] In hindsight the prediction proved to be wildly inaccurate and not representative of the observed sunspot numbers. .[6]
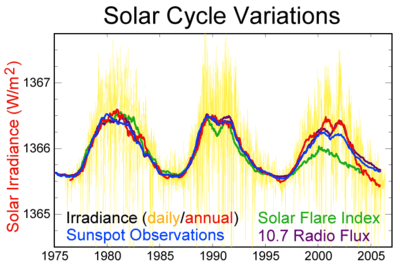
During 2008–2009 NASA scientists noted that the Sun is undergoing a "deep solar minimum," stating: "There were no sunspots observed on 266 of [2008's] 366 days (73%). Prompted by these numbers, some observers suggested that the solar cycle had hit bottom in 2008. Sunspot counts for 2009 dropped even lower. As of September 14, 2009 there were no sunspots on 206 of the year's 257 days (80%). It adds up to one inescapable conclusion: "We're experiencing a very deep solar minimum," says solar physicist Dean Pesnell of the Goddard Space Flight Center. "This is the quietest sun we've seen in almost a century," agrees sunspot expert David Hathaway of the National Space Science and Technology Center NASA/Marshall Space Flight Center.[7]
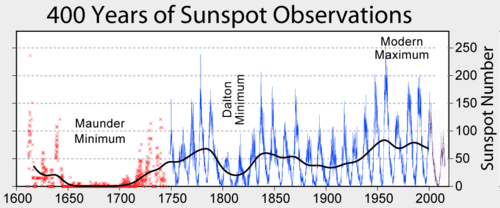
Grand solar minima and maxima
Grand solar minima occur when several solar cycles exhibit lesser than average activity for decades or centuries. Solar cycles still occur during these grand solar minimum periods but are at a lower intensity than usual. Grand solar minima have shown some correlation with global and regional climate changes.
| Event | Start | End |
|---|---|---|
| Homeric minimum [8] | 950BC | 800BC |
| Roman Warm Period | 250 BC | AD 400 |
| Medieval maximum 1 (see Medieval Warm Period) | 950 | 1040 |
| Oort minimum (see Medieval Warm Period) | 1040 | 1080 |
| Medieval maximum 2 (see Medieval Warm Period) | 1100 | 1250 |
| Wolf minimum | 1280 | 1350 |
| Spörer Minimum | 1450 | 1550 |
| Maunder Minimum | 1645 | 1715 |
| Dalton Minimum | 1790 | 1820 |
| Glassberg Minimum | 1880 | 1914 |
| Modern Maximum | 1914 | 2007 |
A list of historical Grand minima of solar activity[9] includes also Grand minima ca. 690 AD, 360 BC, 770 BC, 1390 BC, 2860 BC, 3340 BC, 3500 BC, 3630 BC, 3940 BC, 4230 BC, 4330 BC, 5260 BC, 5460 BC, 5620 BC, 5710 BC, 5990 BC, 6220 BC, 6400 BC, 7040 BC, 7310 BC, 7520 BC, 8220 BC, 9170 BC.
See also
References
- ↑ Moussas, X.; Polygiannakis, J. M.; Preka-Papadema, P.; Exarhos, G. (2005). "Solar cycles: A tutorial". Advances in Space Research. 35 (5): 725–738. Bibcode:2005AdSpR..35..725M. doi:10.1016/j.asr.2005.03.148.
- ↑ "NOAA Space Weather Scales Page Has Changed". noaa.gov.
- ↑ Polygiannakis, J. M.; Moussas, X.; Sonett, C. P. (1996). "A Nonlinear RLC Solar Cycle Model". Solar Physics. 163 (1): 193–203. Bibcode:1996SoPh..163..193P. doi:10.1007/BF00165465.
- ↑ "NASA/Marshall Solar Physics". nasa.gov.
- ↑ "Scientists Issue Unprecedented Forecast of Next Sunspot Cycle – News Release". ucar.edu. Archived from the original on 2006-04-10.
- ↑ "Sunspot Number graphics". oma.be.
- ↑ "Deep Solar Minimum – NASA Science". nasa.gov.
- ↑ Celia Martin-Puertas; Katja Matthes; Achim Brauer; Raimund Muscheler; Felicitas Hansen; et al. (April 2, 2012). "Regional atmospheric circulation shifts induced by a grand solar minimum". Nature Geoscience. 5: 397–401. Bibcode:2012NatGe...5..397M. doi:10.1038/ngeo1460.
- ↑ Usoskin, Ilya G.; Solanki, Sami K.; Kovaltsov, Gennady A. (2007). "Grand minima and maxima of solar activity: new observational constraints" (PDF). Astron. Astrophys. 471 (1): 301–9. arXiv:0706.0385. Bibcode:2007A&A...471..301U. doi:10.1051/0004-6361:20077704.