Chromosphere
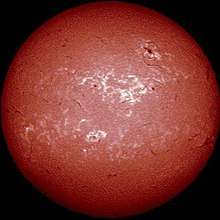
The chromosphere (literally, "sphere of color") is the second of the three main layers in the Sun's atmosphere and is roughly 3,000 to 5,000 kilometers deep. The chromosphere's rosy red color is only apparent during eclipses. The chromosphere sits just above the photosphere and below the solar transition region. The layer of the chromosphere atop the photosphere is homogeneous. A forest of hairy-appearing spicules rise from the homogeneous layer, some of which extend 10,000 km into the corona above.
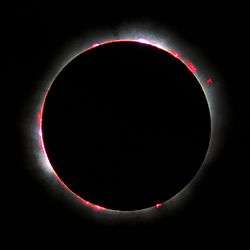
The density of the chromosphere is only 10−4 times that of the photosphere, the layer beneath, and 10−8 times that of the atmosphere of Earth at sea level. This makes the chromosphere normally invisible and it can be seen only during a total eclipse, where its reddish color is revealed. The color hues are anywhere between pink and red.[1] Without special equipment, the chromosphere cannot normally be seen due to the overwhelming brightness of the photosphere beneath.
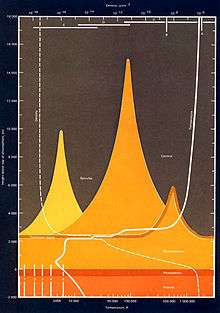
The density of the chromosphere decreases with distance from the center of the Sun. This decreases logarithmically from 1017 particles per cubic centimeter, or approximately 2×10⁻⁴ kg/m3 to under 1.6×10⁻¹¹ kg/m3 at the outer boundary.[2] The temperature decreases from the inner boundary at about 6,000 K[3] to a minimum of approximately 3,800 K,[4] before increasing to upwards of 35,000 K[3] at the outer boundary with the transition layer of the corona.
Chromospheres have been observed also in stars other than the Sun.[5] The sun's chromosphere has always been and will continue to be a body hard to examine and decipher. Although, since it is a point of interest to several individuals, we attempt to observe the chromosphere with the help of the electromagnetic spectrum.[6]
Comparing chromosphere and photosphere
Whilst the photosphere has an absorption line spectrum, the chromosphere's spectrum is dominated by emission lines. In particular, one of its strongest lines is the Hα at a wavelength of 656.3 nm; this line is emitted by a hydrogen atom whenever its electron makes a transition from the n=3 to the n=2 energy level. A wavelength of 656.3 nm is in the red part of the spectrum, which causes the chromosphere to have its characteristic reddish colour.
By analysing the spectrum of the chromosphere, it was found that the temperature of this layer of the solar atmosphere increases with increasing height in the chromosphere itself. The temperature at the top of photosphere is only about 4,400 K, while at the top of chromosphere, some 2,000 km higher, it reaches 25,000 K.[1][7] This is however the opposite of what we find in the photosphere, where the temperature drops with increasing height. It is not yet fully understood what phenomenon causes the temperature of the chromosphere to paradoxically increase further from the Sun's interior. However, it seems likely to be explained, partially or totally, by magnetic reconnection.
Features
Many interesting phenomena can be observed in the chromosphere, which is very complex and dynamic:
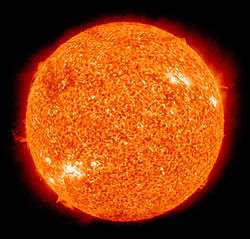
- Filaments (and prominences, which are filaments viewed from the side) underlie many coronal mass ejections and hence are important to the prediction of space weather. Solar prominences rise up through the chromosphere from the photosphere, sometimes reaching altitudes of 150,000 km. These gigantic plumes of gas are the most spectacular of solar phenomena, aside from the less frequent solar flares.
- The most common feature is the presence of spicules, long thin fingers of luminous gas which appear like the blades of a huge field of fiery grass growing upwards from the photosphere below. Spicules rise to the top of the chromosphere and then sink back down again over the course of about 10 minutes. Similarly, there are horizontal wisps of gas called fibrils, which last about twice as long as spicules.
- Images taken in typical chromospheric lines show the presence of brighter cells, usually called as network, while the surrounding darker regions are named internetwork. They look similar to granules commonly observed on the photosphere due to the heat convection.
- Periodic oscillations have been found since the first observations with the instrument SUMER on board SOHO with a frequency from 3 mHz to 10 mHz, corresponding to a characteristic periodic time of three minutes.[8] Oscillations of the radial component of the plasma velocity are typical of the high chromosphere. Now we know that the photospheric granulation pattern has usually no oscillations above 20 mHz while higher frequency waves (100 mHz or a 10 s period) were detected in the solar atmosphere (at temperatures typical of the transition region and corona) by TRACE.[9]
- Cool loops can be seen at the border of the solar disk. They are different from prominences because they look as concentric arches with maximum temperature of the order 0,1 MK (too low to be considered coronal features). These cool loops show an intense variability: they appear and disappear in some UV lines in a time less than an hour, or they rapidly expand in 10–20 minutes. Foukal [10] studied these cool loops in detail from the observations taken with the EUV spectrometer on Skylab in 1976. Otherwise, when the plasma temperature of these loops becomes coronal (above 1 MK), these features appear more stable and evolve on longer times.
See the flash spectrum of the solar chromosphere (Eclipse of March 7, 1970).
On other stars
A spectroscopic measure of chromospheric activity on other stars is the Mount Wilson S-index.[11] [12] See also Superflare#Spectroscopic observations of superflare stars.
See also
References
- 1 2 Freedman, R. A.; Kaufmann III, W. J. (2008). Universe. New York, USA: W. H. Freeman and Co. p. 762. ISBN 978-0-7167-8584-2.
- ↑ Kontar, E. P.; Hannah, I. G.; Mackinnon, A. L. (2008), "Chromospheric magnetic field and density structure measurements using hard X-rays in a flaring coronal loop", Astronomy and Astrophysics, 489 (3): L57, arXiv:0808.3334, Bibcode:2008A&A...489L..57K, doi:10.1051/0004-6361:200810719
- 1 2 "SP-402 A New Sun: The Solar Results From Skylab". Archived from the original on 2004-11-18.
- ↑ Avrett, E. H. (2003), "The Solar Temperature Minimum and Chromosphere", ASP Conference Series, 286: 419, Bibcode:2003ASPC..286..419A, ISBN 1-58381-129-X
- ↑ "The Chromosphere".
- ↑ Jess, D.B; Morton, RJ; Verth, G; Fedun, V; Grant, S.T.D; Gigiozis, I. (July 2015). ""Multiwavelength Studies of MHD Waves in the Solar Chromosphere."". Space Science Reviews. 190: 103–161. arXiv:1503.01769. Bibcode:2015SSRv..190..103J. doi:10.1007/s11214-015-0141-3 – via EBSCOhost.
- ↑ "World Book at NASA – Sun".
- ↑ Carlsson, M.; Judge, P.; Wilhelm, K. (1997). "SUMER Observations Confirm the Dynamic Nature of the Quiet Solar Outer Atmosphere: The Internetwork Chromosphere". The Astrophysical Journal. 486: L63. arXiv:astro-ph/9706226. Bibcode:1997ApJ...486L..63C. doi:10.1086/310836.
- ↑ De Forest, C.E. (2004). "High-Frequency Waves Detected in the Solar Atmosphere". The Astrophysical Journal. 617: L89. Bibcode:2004ApJ...617L..89D. doi:10.1086/427181.
- ↑ Foukal, P.V. (1976). "The pressure and energy balance of the cool corona over sunspots". The Astrophysical Journal. 210: 575. Bibcode:1976ApJ...210..575F. doi:10.1086/154862.
- ↑ Observational evidence for enhanced magnetic activity of superflare stars
- ↑ A small survey of the magnetic fields of planet-hosting stars gives "Wright J. T., Marcy G. W., Butler R. P., Vogt S. S., 2004, ApJS, 152, 261" as a ref for s-index.
External links
- Animated explanation of the Chromosphere (and Transition Region) (University of South Wales).
- Animated explanation of the temperature of the Chromosphere (and Transition Region) (University of South Wales).
| Formation | |
|---|---|
| Evolution | |
| Luminosity class | |
| Spectral classification | |
| Remnants | |
| Hypothetical stars | |
| Nucleosynthesis | |
| Structure | |
| Properties | |
| Star systems | |
| Earth-centric observation of | |
| Lists | |
| Related articles | |