sar (Unix)
| Stable release |
sysstat 11.6.4[1]
/ June 1, 2018 |
|---|---|
| Preview release |
sysstat 11.7.4
/ June 1, 2018 [2] |
| Repository |
github |
| Written in | C |
| Operating system | AIX, Linux, Solaris, HP-UX |
| Type | System reporting |
| Website |
sebastien |
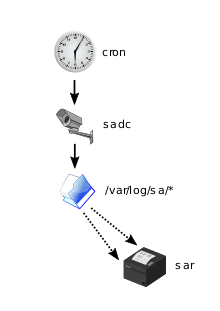
Called regularly by cron, sadc does the monitoring and stores its measurements to files in the /var/log/sa/ folder. The sar client can be used to explore this data.
System Activity Report (sar) is a Unix System V-derived system monitor command used to report on various system loads, including CPU activity, memory/paging, interrupts, device load, network and swap space utilization. Sar uses /procfilesystem for gathering information [3]
Platform support
Sar was originally developed for Solaris operating system[4] and it is available in Linux, Solaris, AIX, HP-UX, but it is not available for MacOS or FreeBSD, until 2013 there was a bsdsar tool actually deprecated [5].
Linux distributions, such as Red Hat Enterprise Linux and SuSe[6] provide sar utility through the sysstat package.
Syntax
sar [-flags] [ -e time ] [ -f filename ] [-i sec ] [ -s time ]

-f filename Uses filename as the data source for sar. The default is the current daily data file /var/adm/sa/sadd.

-e time Selects data up to time. The default is 18:00.

-i sec Selects data at intervals as close as possible to sec seconds.
Example
[user@localhost]$ sar # Displays current CPU activity.
Sysstat package
Additional to sar command, Linux sysstat package in Debian[7], RedHat Enterprise Linux and SuSE provides additional reporting tools:
- sar [8], Collect, report, or save system activity information.
- sa1 [9], Collect and store binary data in the system activity daily data file
- sa2 [10], shell variant of
sar, supporting the same flags assarcommand which write a daily report in the /var/log/sa directory - sadf(1) [11], similar to
sarbut can write its data in different formats (CSV, XML, etc.). This is useful to load performance data into a database, or import them in a spreadsheet to make graphs. - iostat (1) reports basic CPU statistics and input/output statistics for devices, partitions and network filesystems.
- mpstat(1) reports individual or combined processor related statistics.
- pidstat(1) reports statistics for Linux tasks (processes) : I/O, CPU, memory, etc.
- nfsiostat(1) reports input/output statistics for network filesystems (NFS).
- cifsiostat(1) reports I/O statistics for CIFS resources.
See also
- atopsar
- Nmon
sag- "system activity graph" command[12]- ksar- BSD licensed Java-based application to create graph of all parameters from the data collected by Unix sar utilities.
- CURT, IBM AIX CPU Usage Reporting Tool
- isag, tcl based command to plot sar/sysstat data
References
Footnotes
- ↑ https://github.com/sysstat/sysstat/releases/tag/v11.6.4
- ↑ http://sebastien.godard.pagesperso-orange.fr/
- ↑ http://sebastien.godard.pagesperso-orange.fr/man_sar.html
- ↑ https://www.itworld.com/article/2786092/open-source-tools/unix-tip--using-sar-for-long-term-performance-analysis.html
- ↑ https://www.freshports.org/sysutils/bsdsar
- ↑ http://www.softpanorama.org/Admin/Monitoring/sar.shtml
- ↑ https://packages.debian.org/sid/sysstat
- ↑ https://linux.die.net/man/1/sar
- ↑ https://linux.die.net/man/8/sa1
- ↑ https://linux.die.net/man/8/sa2
- ↑ http://sebastien.godard.pagesperso-orange.fr/man_sadf.html
- ↑
"sag(1)" (PDF). SUNOS Reference Manual. Mountain View, California: Sun Microsystems. 1993-02-24. pp. 1–895. Retrieved 2010-05-04.
sag - system activity graph [...] DESCRIPTION sag graphically displays the system activity data stored in a binary data file by a previous sar(1) run.
This article is issued from
Wikipedia.
The text is licensed under Creative Commons - Attribution - Sharealike.
Additional terms may apply for the media files.