nmon
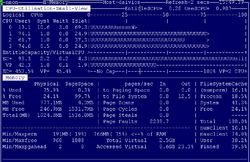 nmon showing the basics: CPU and memory | |
| Developer(s) | Nigel Griffiths (IBM) |
|---|---|
| Operating system | AIX, Linux |
| Type | System monitor |
| License | open source (since July 2009) |
| Website |
nmon |
nmon (short hand for Nigel's Monitor[1]) is a computer performance system monitor tool for the AIX and Linux operating systems. The nmon tool has two modes a) displays the performance stats on-screen in a condensed format or b) the same stats are saved to a comma-separated values (CSV) data file for later graphing and analysis to aid the understanding of computer resource use, tuning options and bottlenecks.
Description
nmon collects the following operating system statistics:
- CPU and CPU threads Utilisation
- CPU frequency for servers or virtual machines that can alter their clock rate
- GPU stats including utilisation, MHz and temperatures
- Physical and Virtual Memory use
- Disk read & write and transfers plus service time and wait times
- Disk Groups - decided by the user
- Swap and Paging
- Network read & write and transfers
- Local File-systems
- Network File-system (NFS)
- Top Processes by CPU use, Memory size and I/O rates
- Kernel stats including Run Queue, context-switch, fork, Load Average & Uptime
- Large and Huge memory pages
- NFS (Networked File System)
- Virtual Machine stats (depending on the hardware) — useful for Linux running KVM to host virtual machines
- Resources in the Server and virtual machine
nmon -hlists the details- To start collecting the stats to a file use the
-for-Foption
When viewing in on-screen mode the stats displayed are controlled by the user using single letter toggles. For example, "c" to show CPU and then another "c" will switch the CPU stats off. Use h to display a list of the options.
When saving the stats to a file, there is a common default set of stats and then users can request more using command line options. Use nmon -? to display all the options.
The saved file is in a comma separated values format (CSV) with a simple for later processing and graphing.
History
The original nmon version was for the IBM AIX operating system (Release 4.3 and above) and was freely downloadable binary format only tool from the IBM AIX wiki.[2]
- Later a version was written for the Linux operating system running on IA-32, x86, x86_64, IBM RS/6000 and POWER processors, Mainframe and ARM (including Raspberry Pi). nmon for Linux was released by IBM to open source in July 2009. The code is available from the Sourceforge open source repository.[3]
- The nmon for AIX code was later bundled in as part of the AIX operating systems. From AIX 5.3 TL09 and AIX 6.1 TL02 onward it was included in the default installation of AIX and fully supported by IBM. The nmon command[4] and the topas command[5] are the same binary but behave differently depending on the command name used. Users can switch between topas mode and nmon mode with the tilde (~) key.
The two editions (AIX and Linux) have completely different source code but offer many similar features, command line options and data — as much as the underlying operating system allow. nmon is used by AIX and Linux Systems Administrators and performance tuning specialists around the world. There have been 600,000 downloads of nmon for Linux from SourceForge, showing it popularity and it is found in Linux operating System Repositories.
Features
- There are two runtime modes available:
- In Online Mode it uses curses for efficient screen handling, which updates the terminal frequently for real-time monitoring.
- In Capture Mode, the data is saved to a file in CSV format for later processing and graphing. The file also includes important configuration details that are useful for recommending tuning.
nmonconcentrates on performance information for the performance tuner and in a concise layout to aid understanding. This includes CPU, memory, disks, adapters, networks, NFS, Kernel statistics, File-systems, Workload Manager (AIX), Workload Partitions (AIX) and Top Processes.nmonincludes support for older AIX releases, Linux running on x86, POWER and Mainframe platforms and other Linux supporting hardware.
Screenshots
- CPU Utilisation and Memory statistics
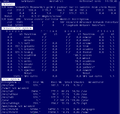 NFS and Filesystem statistics
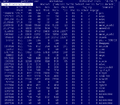 top Processes sorted by CPU used
Alternatives
On AIX, there is the topas command that can output reports to a file but this is not in a format that can be used easily as a source for a spread sheet or web tools like rrdtool.
On Linux, there is the top command which is good for CPU and processes but does not cover disks and networks. For disk I/O, the iostat command can give you the details and ntop for network information. But neither of these commands allow saving data in a format suitable for a spreadsheet or simple further processing. Linux utility dstat can be used to produce text data, even in comma separated value format, which is quite suitable for spreadsheet programs.
References
- ↑ Admin Magazine review of the nmon tool www
.admin-magazine .com /HPC /Articles /Nmon-All-Purpose-Admin-Tool - ↑ IBM DevelopmentWorks AIX wiki page for nmon www
.ibm .com /developerworks /aix /library /au-analyze _aix / - ↑ nmon for Linux, C source code and Linux pre-compiled binaries
- ↑ IBM Knowledge center website http://www-01.ibm.com/support/knowledgecenter/ssw_aix_61/com.ibm.aix.cmds4/nmon.htm
- ↑ IBM Knowledge center website http://www-01.ibm.com/support/knowledgecenter/ssw_aix_61/com.ibm.aix.cmds4/topas.htm