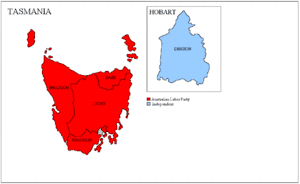
Results of the Australian federal election, 2010 (Tasmania)
| Party | Votes | % | Swing | Seats | Change | ||
|---|---|---|---|---|---|---|---|
| Australian Labor Party | 143,796 | 43.95 | +1.18 | 4 | –1 | ||
| Liberal Party of Australia | 109,908 | 33.60 | –4.62 | 0 | 0 | ||
| Australian Greens | 55,042 | 16.82 | +3.32 | 0 | 0 | ||
| Secular Party of Australia | 1,085 | 0.33 | +0.33 | 0 | 0 | ||
| Socialist Alliance | 856 | 0.26 | +0.00 | 0 | 0 | ||
| Citizens Electoral Council | 838 | 0.26 | −0.31 | 0 | 0 | ||
| Independents | 15,627 | 4.78 | +2.56 | 1 | +1 | ||
| Total | 327,152 | 5 | |||||
| Two-party-preferred vote | |||||||
| Australian Labor Party | 198,332 | 60.62 | +4.41 | 4 | –1 | ||
| Liberal Party of Australia | 128,830 | 39.38 | –4.41 | 0 | 0 | ||
This is a list of electoral division results for the Australian 2010 federal election in the state of Tasmania.[1] [2]

Electoral divisions: Tasmania
Results by division
Bass
| Party | Candidate | Votes | % | ± | |
|---|---|---|---|---|---|
| Labor | Geoff Lyons | 28,448 | 43.43 | +6.17 | |
| Liberal | Steve Titmus | 26,010 | 39.71 | -3.71 | |
| Greens | Sancia Colgrave | 10,206 | 15.58 | +0.44 | |
| CEC | Adrian Watts | 838 | 1.28 | +0.93 | |
| Total formal votes | 65,502 | 96.02 | -0.75 | ||
| Informal votes | 2,714 | 3.98 | +0.75 | ||
| Turnout | 68,216 | 95.16 | -1.14 | ||
| Two-party-preferred result | |||||
| Labor | Geoff Lyons | 37,165 | 56.74 | +5.71 | |
| Liberal | Steve Titmus | 28,337 | 43.26 | -5.71 | |
| Labor hold | Swing | +5.71 | |||
Braddon
| Party | Candidate | Votes | % | ± | |
|---|---|---|---|---|---|
| Labor | Sid Sidebottom | 31,890 | 48.68 | +4.48 | |
| Liberal | Garry Carpenter | 25,779 | 39.35 | -3.59 | |
| Greens | Scott Jordan | 7,836 | 11.96 | +3.83 | |
| Total formal votes | 65,505 | 95.68 | -1.14 | ||
| Informal votes | 2,961 | 4.32 | +1.14 | ||
| Turnout | 68,466 | 95.66 | -0.62 | ||
| Two-party-preferred result | |||||
| Labor | Sid Sidebottom | 37,650 | 57.48 | +5.16 | |
| Liberal | Garry Carpenter | 27,855 | 42.52 | -5.16 | |
| Labor hold | Swing | +5.16 | |||
Denison
| Party | Candidate | Votes | % | ± | |
|---|---|---|---|---|---|
| Labor | Jonathan Jackson | 23,215 | 35.79 | -12.37 | |
| Liberal | Cameron Simpkins | 14,688 | 22.65 | -7.34 | |
| Independent | Andrew Wilkie | 13,788 | 21.26 | +21.26 | |
| Greens | Geoffrey Couser | 12,312 | 18.98 | +0.40 | |
| Socialist Alliance | Mel Barnes | 856 | 1.32 | +0.56 | |
| Total formal votes | 64,859 | 96.38 | -1.12 | ||
| Informal votes | 2,435 | 3.62 | +1.12 | ||
| Turnout | 67,294 | 94.32 | -1.21 | ||
| Two-party-preferred result | |||||
| Independent | Andrew Wilkie | 33,217 | 51.21 | +51.21 | |
| Labor | Jonathan Jackson | 31,642 | 48.79 | -16.50 | |
| Independent gain from Labor | Swing | +51.21 | |||
Franklin
| Party | Candidate | Votes | % | ± | |
|---|---|---|---|---|---|
| Labor | Julie Collins | 28,079 | 42.85 | +2.17 | |
| Liberal | Jane Howlett | 21,938 | 33.48 | -7.82 | |
| Greens | Wendy Heatley | 13,675 | 20.87 | +6.15 | |
| Independent | John Forster | 1,839 | 2.81 | +2.81 | |
| Total formal votes | 65,531 | 96.52 | -0.83 | ||
| Informal votes | 2,365 | 3.48 | +0.83 | ||
| Turnout | 67,896 | 95.51 | -0.35 | ||
| Two-party-preferred result | |||||
| Labor | Julie Collins | 39,856 | 60.82 | +6.79 | |
| Liberal | Jane Howlett | 25,675 | 39.18 | -6.79 | |
| Labor hold | Swing | +6.79 | |||
Lyons
| Party | Candidate | Votes | % | ± | |
|---|---|---|---|---|---|
| Labor | Dick Adams | 32,164 | 48.91 | +5.42 | |
| Liberal | Eric Hutchinson | 21,493 | 32.69 | -0.79 | |
| Greens | Karen Cassidy | 11,013 | 16.75 | +5.79 | |
| Secular | Lucas Noyes | 1,085 | 1.65 | +1.65 | |
| Total formal votes | 65,755 | 95.20 | -1.74 | ||
| Informal votes | 3,316 | 4.80 | +1.74 | ||
| Turnout | 69,071 | 94.79 | -0.05 | ||
| Two-party-preferred result | |||||
| Labor | Dick Adams | 40,959 | 62.29 | +3.95 | |
| Liberal | Eric Hutchinson | 24,796 | 37.71 | -3.95 | |
| Labor hold | Swing | +3.95 | |||
See also
References
- ↑ "2010 First preference votes for Tasmania". AEC.
- ↑ "2010 Tasmanian division results". AEC.
- ↑ "2010 results for Bass". AEC.
- ↑ "2010 results for Braddon". AEC.
- ↑ "2010 results for Denison". AEC.
- ↑ "2010 results for Franklin". AEC.
- ↑ "2010 results for Lyons". AEC.
This article is issued from
Wikipedia.
The text is licensed under Creative Commons - Attribution - Sharealike.
Additional terms may apply for the media files.