This is the results breakdown of the local elections held in the Basque Country on 8 May 1983. The following tables show detailed results in the autonomous community's most populous municipalities, sorted alphabetically.[1]
Overall
Councillor share for different parties in the elections.
HK (0.65%)
BA (0.20%)
Other (10.64%)
← Summary of the 8 May 1983 municipal election results in the Basque Country →
| Parties and coalitions |
Popular vote |
Councillors |
| Votes |
% |
±pp |
Total |
+/− |
|
Basque Nationalist Party (EAJ/PNV) |
392,406 | 39.19 | +1.70 |
1,257 | +175 |
|
Socialist Party of the Basque Country (PSE–PSOE) |
257,291 | 25.70 | +10.60 |
353 | +150 |
|
Popular Unity (HB) |
136,470 | 13.63 | –2.08 |
327 | +65 |
|
People's Coalition (AP–PDP–UL)1 |
77,846 | 7.77 | +7.73 |
97 | +94 |
|
Basque Country Left (EE) |
73,281 | 7.32 | +1.19 |
122 | +39 |
|
Communist Party of the Basque Country (PCE/EPK) |
20,791 | 2.08 | –2.56 |
14 | –27 |
|
Democratic and Social Centre (CDS) |
4,675 | 0.47 | New |
2 | +2 |
|
Bermean Nationalists (Bermeoko Adiskideak) |
2,554 | 0.26 | New |
5 | +5 |
|
Neighborhood Labor (Auzolan) |
2,517 | 0.25 | –1.97 |
2 | –11 |
|
Neighborhood Labor (Auzolan) |
1,601 | 0.16 | New |
1 | +1 |
|
Communist Movement of the Basque Country (EMK/MCE) |
517 | 0.05 | –1.58 |
0 | –8 |
|
Revolutionary Communist League (LKI/LCR) |
399 | 0.04 | –0.55 |
1 | –4 |
|
United Left (Ezker Batua) |
2,316 | 0.23 | New |
3 | +3 |
|
Workers' Socialist Party (PST) |
2,091 | 0.21 | New |
0 | ±0 |
|
Popular Candidacy (Herri Kandidatura) |
1,707 | 0.17 | New |
16 | +16 |
|
Independent Electors' Group (AEI) |
1,518 | 0.16 | New |
0 | ±0 |
|
Uranzu–Independent Candidacy (Uranzu) |
1,386 | 0.14 | –0.13 |
1 | –2 |
|
Others |
17,505 | 1.75 | — |
253 | –485 |
| Blank ballots |
6,900 | 0.69 | –0.05 |
|
|
| Total |
1,001,317 | |
2,452 | +24 |
|
| Valid votes |
1,001,317 | 98.66 | +0.02 |
|
| Invalid votes |
13,615 | 1.34 | –0.02 |
| Votes cast / turnout |
1,014,932 | 64.70 | +2.68 |
| Abstentions |
553,772 | 35.30 | –2.68 |
| Registered voters |
1,568,704 | |
|
| Sources[1][2][3] |
|
|
Municipalities
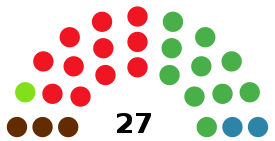
Baracaldo
- Population: 118,615
← Summary of the 8 May 1983 City Council of Baracaldo election results →
|
| Parties and coalitions |
Popular vote |
Seats |
| Votes |
% |
±pp |
Total |
+/− |
|
Socialist Party of the Basque Country (PSE–PSOE) |
21,305 | 37.39 | +16.12 |
11 | +4 |
|
Basque Nationalist Party (EAJ/PNV) |
18,005 | 31.60 | +5.39 |
10 | +2 |
|
Popular Unity (HB) |
6,340 | 11.13 | –12.80 |
3 | –4 |
|
People's Coalition (AP–PDP–UL) |
4,521 | 7.94 | New |
2 | +2 |
|
Basque Country Left (EE) |
3,092 | 5.43 | +1.10 |
1 | +1 |
|
|
Communist Party of the Basque Country (PCE/EPK) |
2,246 | 3.94 | –3.18 |
0 | –2 |
|
United Left (Ezker Batua) |
671 | 1.18 | New |
0 | ±0 |
|
Workers' Socialist Party (PST) |
459 | 0.81 | New |
0 | ±0 |
|
Communist League (LC) |
144 | 0.25 | New |
0 | ±0 |
|
Union of the Democratic Centre (UCD) |
n/a | n/a | –11.42 |
0 | –3 |
| Blank ballots |
191 | 0.34 | +0.09 |
|
|
| Total |
56,974 | |
27 | ±0 |
|
| Valid votes |
56,974 | 98.85 | –0.21 |
|
| Invalid votes |
665 | 1.15 | +0.21 |
| Votes cast / turnout |
57,639 | 65.04 | +3.91 |
| Abstentions |
30,985 | 34.96 | –3.91 |
| Registered voters |
88,624 | |
|
| Sources[1][2][4] |
Bilbao
- Population: 433,115
← Summary of the 8 May 1983 City Council of Bilbao election results →
|
| Parties and coalitions |
Popular vote |
Seats |
| Votes |
% |
±pp |
Total |
+/− |
|
Basque Nationalist Party (EAJ/PNV) |
67,211 | 36.38 | –2.87 |
11 | –2 |
|
Socialist Party of the Basque Country (PSE–PSOE) |
51,108 | 27.66 | +13.73 |
9 | +5 |
|
People's Coalition (AP–PDP–UL) |
26,529 | 14.36 | New |
4 | +4 |
|
Popular Unity (HB) |
18,483 | 10.00 | –7.25 |
3 | –3 |
|
Basque Country Left (EE) |
13,070 | 7.07 | +1.57 |
2 | +1 |
|
|
Communist Party of the Basque Country (PCE/EPK) |
2,764 | 1.50 | –2.51 |
0 | ±0 |
|
Democratic and Social Centre (CDS) |
1,731 | 0.94 | New |
0 | ±0 |
|
Workers' Socialist Party (PST) |
1,583 | 0.86 | New |
0 | ±0 |
|
Independent Electors' Group (AEI) |
1,518 | 0.82 | New |
0 | ±0 |
|
Union of the Democratic Centre (UCD) |
n/a | n/a | –17.19 |
0 | –5 |
| Blank ballots |
768 | 0.42 | +0.15 |
|
|
| Total |
184,765 | |
29 | ±0 |
|
| Valid votes |
184,765 | 98.90 | –0.20 |
|
| Invalid votes |
2,053 | 1.10 | +0.20 |
| Votes cast / turnout |
186,818 | 62.86 | +3.38 |
| Abstentions |
110,367 | 37.14 | –3.38 |
| Registered voters |
297,185 | |
|
| Sources[1][2][5][6] |
Donostia-San Sebastián
- Population: 172,303
← Summary of the 8 May 1983 City Council of Donostia-San Sebastián election results →
|
| Parties and coalitions |
Popular vote |
Seats |
| Votes |
% |
±pp |
Total |
+/− |
|
Basque Nationalist Party (EAJ/PNV) |
26,806 | 34.91 | +5.10 |
10 | +1 |
|
Socialist Party of the Basque Country (PSE–PSOE) |
18,271 | 23.80 | +8.00 |
7 | +3 |
|
Popular Unity (HB) |
13,621 | 17.74 | –3.13 |
5 | –1 |
|
People's Coalition (AP–PDP–UL)1 |
9,581 | 12.48 | +12.48 |
3 | +3 |
|
Basque Country Left (EE) |
6,530 | 8.50 | –3.13 |
2 | –1 |
|
|
Communist Party of the Basque Country (PCE/EPK) |
867 | 1.13 | –1.18 |
0 | ±0 |
|
Democratic and Social Centre (CDS) |
793 | 1.03 | New |
0 | ±0 |
|
Independent Coordinator (UCD–DCV) (CI) |
n/a | n/a | –16.46 |
0 | –5 |
| Blank ballots |
314 | 0.41 | +0.13 |
|
|
| Total |
76,783 | |
27 | ±0 |
|
| Valid votes |
76,783 | 99.40 | +0.10 |
|
| Invalid votes |
462 | 0.60 | –0.10 |
| Votes cast / turnout |
77,245 | 58.48 | +3.35 |
| Abstentions |
54,853 | 41.52 | –3.35 |
| Registered voters |
132,098 | |
|
| Sources[1][2][7] |
|
|
Getxo
- Population: 67,793
← Summary of the 8 May 1983 City Council of Getxo election results →
|
| Parties and coalitions |
Popular vote |
Seats |
| Votes |
% |
±pp |
Total |
+/− |
|
Basque Nationalist Party (EAJ/PNV) |
14,715 | 45.95 | +0.70 |
12 | –1 |
|
People's Coalition (AP–PDP–UL) |
6,274 | 19.59 | New |
5 | +5 |
|
Socialist Party of the Basque Country (PSE–PSOE) |
4,870 | 15.21 | +8.77 |
4 | +3 |
|
Popular Unity (HB) |
3,238 | 10.11 | –6.62 |
2 | –2 |
|
Basque Country Left (EE) |
2,395 | 7.48 | +3.11 |
2 | +2 |
|
|
Communist Party of the Basque Country (PCE/EPK) |
396 | 1.24 | –1.33 |
0 | ±0 |
|
Union of the Democratic Centre (UCD) |
n/a | n/a | –23.19 |
0 | –7 |
| Blank ballots |
138 | 0.43 | +0.17 |
|
|
| Total |
32,026 | |
25 | ±0 |
|
| Valid votes |
32,026 | 99.23 | –0.05 |
|
| Invalid votes |
247 | 0.77 | +0.05 |
| Votes cast / turnout |
32,273 | 66.88 | +4.64 |
| Abstentions |
15,982 | 33.12 | –4.64 |
| Registered voters |
48,255 | |
|
| Sources[1][2][8] |
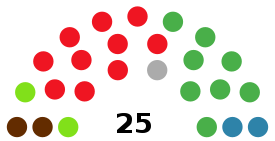
Irún
- Population: 53,334
← Summary of the 8 May 1983 City Council of Irún election results →
|
| Parties and coalitions |
Popular vote |
Seats |
| Votes |
% |
±pp |
Total |
+/− |
|
Socialist Party of the Basque Country (PSE–PSOE) |
9,061 | 37.01 | +8.71 |
10 | +1 |
|
Basque Nationalist Party (EAJ/PNV) |
7,231 | 29.54 | +2.25 |
8 | ±0 |
|
Popular Unity (HB) |
2,284 | 9.33 | –1.95 |
2 | –1 |
|
Basque Country Left (EE) |
2,024 | 8.27 | –1.04 |
2 | ±0 |
|
People's Coalition (AP–PDP–UL) |
1,980 | 8.09 | New |
2 | +2 |
|
Uranzu–Independent Candidacy (Uranzu) |
1,386 | 5.66 | –5.99 |
1 | –2 |
|
|
Communist Party of the Basque Country (PCE/EPK) |
399 | 1.63 | –2.70 |
0 | ±0 |
| Blank ballots |
115 | 0.47 | –1.34 |
|
|
| Total |
24,480 | |
25 | ±0 |
|
| Valid votes |
24,480 | 98.84 | +0.58 |
|
| Invalid votes |
288 | 1.16 | –0.58 |
| Votes cast / turnout |
24,768 | 63.57 | +4.32 |
| Abstentions |
14,193 | 36.43 | –4.32 |
| Registered voters |
38,961 | |
|
| Sources[1][2][9] |
Vitoria-Gasteiz
- Population: 189,533
← Summary of the 8 May 1983 City Council of Vitoria-Gasteiz election results →
|
| Parties and coalitions |
Popular vote |
Seats |
| Votes |
% |
±pp |
Total |
+/− |
|
Basque Nationalist Party (EAJ/PNV) |
31,250 | 35.39 | +3.24 |
11 | +1 |
|
Socialist Party of the Basque Country (PSE–PSOE) |
27,963 | 31.67 | +13.22 |
9 | +3 |
|
People's Coalition (AP–PDP–UL) |
12,823 | 14.52 | New |
4 | +4 |
|
Popular Unity (HB) |
7,576 | 8.58 | New |
2 | +2 |
|
Basque Country Left (EE) |
5,119 | 5.80 | +1.04 |
1 | +1 |
|
|
Democratic and Social Centre (CDS) |
2,067 | 2.34 | New |
0 | ±0 |
|
Communist Party of the Basque Country (PCE/EPK) |
1,132 | 1.28 | –2.58 |
0 | ±0 |
|
Union of the Democratic Centre (UCD) |
n/a | n/a | –25.83 |
0 | –8 |
|
Independents of Vitoria (IV) |
n/a | n/a | –10.13 |
0 | –3 |
| Blank ballots |
370 | 0.42 | +0.08 |
|
|
| Total |
88,300 | |
27 | ±0 |
|
| Valid votes |
88,300 | 98.74 | –0.57 |
|
| Invalid votes |
1,127 | 1.26 | +0.57 |
| Votes cast / turnout |
89,427 | 65.92 | +1.52 |
| Abstentions |
46,239 | 34.08 | –1.52 |
| Registered voters |
135,666 | |
|
| Sources[1][2][10] |