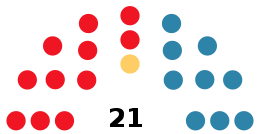
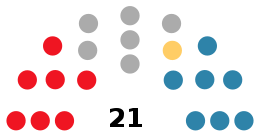
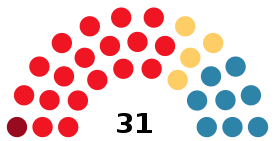
Results breakdown of the Spanish local elections, 1983 (Aragon)
This is the results breakdown of the local elections held in Aragon on 8 May 1983. The following tables show detailed results in the autonomous community's most populous municipalities, sorted alphabetically.[1]
Municipalities
Huesca
- Population: 41,455
 | ||||||
| Parties and coalitions | Popular vote | Seats | ||||
|---|---|---|---|---|---|---|
| Votes | % | ±pp | Total | +/− | ||
| Spanish Socialist Workers' Party (PSOE) | 9,033 | 45.58 | +15.99 | 11 | +4 | |
| People's Coalition (AP–PDP–UL) | 7,326 | 36.96 | New | 9 | +9 | |
| Regionalist Aragonese Party (PAR) | 1,038 | 5.24 | New | 1 | +1 | |
| Communist Party of Spain (PCE) | 990 | 4.99 | –0.79 | 0 | –1 | |
| Democratic and Social Centre (CDS) | 899 | 4.54 | New | 0 | ±0 | |
| Liberal Democratic Party (PDL) | 534 | 2.69 | New | 0 | ±0 | |
| Union of the Democratic Centre (UCD) | n/a | n/a | –42.42 | 0 | –10 | |
| Independent of Huesca (IdH) | n/a | n/a | –11.13 | 0 | –2 | |
| Communist Movement of Aragon (MCA) | n/a | n/a | –5.80 | 0 | –1 | |
| Blank ballots | 0 | 0.00 | ±0.00 | |||
| Total | 19,820 | 21 | ±0 | |||
| Valid votes | 19,820 | 100.00 | +2.12 | |||
| Invalid votes | 0 | 0.00 | –2.12 | |||
| Votes cast / turnout | 19,820 | 63.67 | +0.32 | |||
| Abstentions | 11,310 | 36.33 | –0.32 | |||
| Registered voters | 31,130 | |||||
| Sources[1][2] | ||||||
Teruel
- Population: 25,935
 | |||||||||
| Parties and coalitions | Popular vote | Seats | |||||||
|---|---|---|---|---|---|---|---|---|---|
| Votes | % | ±pp | Total | +/− | |||||
| People's Coalition (AP–PDP–UL) | 4,144 | 30.83 | New | 7 | +7 | ||||
| Spanish Socialist Workers' Party (PSOE) | 3,981 | 29.62 | +4.78 | 7 | +2 | ||||
| Free Independents (IL) | 3,701 | 27.53 | New | 6 | +6 | ||||
| Regionalist Aragonese Party (PAR) | 785 | 5.84 | New | 1 | +1 | ||||
| Democratic and Social Centre (CDS) | 344 | 2.56 | New | 0 | ±0 | ||||
| Communist Party of Spain (PCE) | 252 | 1.87 | –4.16 | 0 | –1 | ||||
| United Left of Aragon (MCA–LCR)1 | 235 | 1.75 | +0.84 | 0 | ±0 | ||||
| Union of the Democratic Centre (UCD) | n/a | n/a | –44.28 | 0 | –10 | ||||
| Electoral Group of Teruel (AET) | n/a | n/a | –22.31 | 0 | –5 | ||||
| Blank ballots | 0 | 0.00 | ±0.00 | ||||||
| Total | 13,442 | 21 | ±0 | ||||||
| Valid votes | 13,442 | 100.00 | ±0.00 | ||||||
| Invalid votes | 0 | 0.00 | ±0.00 | ||||||
| Votes cast / turnout | 13,442 | 65.52 | +3.12 | ||||||
| Abstentions | 7,074 | 34.48 | –3.12 | ||||||
| Registered voters | 20,516 | ||||||||
| Sources[1][3] | |||||||||
| |||||||||
Zaragoza
- Population: 571,855
 | |||||||||
| Parties and coalitions | Popular vote | Seats | |||||||
|---|---|---|---|---|---|---|---|---|---|
| Votes | % | ±pp | Total | +/− | |||||
| Spanish Socialist Workers' Party (PSOE) | 136,774 | 52.36 | +21.45 | 18 | +7 | ||||
| People's Coalition (AP–PDP–UL)1 | 58,134 | 22.25 | +19.75 | 8 | +8 | ||||
| Regionalist Aragonese Party (PAR) | 34,812 | 13.33 | –5.22 | 4 | –3 | ||||
| Communist Party of Spain (PCE) | 14,184 | 5.43 | –5.96 | 1 | –3 | ||||
| Democratic and Social Centre (CDS) | 8,219 | 3.15 | New | 0 | ±0 | ||||
| United Left of Aragon (MCA–LCR)2 | 4,494 | 1.72 | –2.74 | 0 | ±0 | ||||
| Workers' Socialist Party (PST) | 2,820 | 1.08 | New | 0 | ±0 | ||||
| Communist Party of Aragon (PCA) | 828 | 0.32 | New | 0 | ±0 | ||||
| Social Aragonese Movement (MAS) | 692 | 0.26 | New | 0 | ±0 | ||||
| Popular Struggle Coalition (CLP) | 261 | 0.10 | New | 0 | ±0 | ||||
| Union of the Democratic Centre (UCD) | n/a | n/a | –20.47 | 0 | –7 | ||||
| Party of Labour of Aragon (PTA) | n/a | n/a | –6.58 | 0 | –2 | ||||
| Blank ballots | 0 | 0.00 | ±0.00 | ||||||
| Total | 261,218 | 31 | ±0 | ||||||
| Valid votes | 261,218 | 100.00 | +1.32 | ||||||
| Invalid votes | 0 | 0.00 | –1.32 | ||||||
| Votes cast / turnout | 261,218 | 61.76 | +3.20 | ||||||
| Abstentions | 161,715 | 38.24 | –3.20 | ||||||
| Registered voters | 422,933 | ||||||||
| Sources[1][4][5] | |||||||||
| |||||||||
References
- 1 2 3 4 "Municipal elections in Aragon and La Rioja since 1979". historiaelectoral.com (in Spanish). Electoral History. Retrieved 30 September 2017.
- ↑ "Electoral Results Consultation. Municipal. May 1983. Huesca Municipality". infoelectoral.mir.es (in Spanish). Ministry of the Interior. Retrieved 19 March 2018.
- ↑ "Electoral Results Consultation. Municipal. May 1983. Teruel Municipality". infoelectoral.mir.es (in Spanish). Ministry of the Interior. Retrieved 19 March 2018.
- ↑ "Electoral Results Consultation. Municipal. May 1983. Zaragoza Municipality". infoelectoral.mir.es (in Spanish). Ministry of the Interior. Retrieved 19 March 2018.
- ↑ "Municipal elections in Zaragoza since 1979". historiaelectoral.com (in Spanish). Electoral History. Retrieved 24 February 2018.
This article is issued from
Wikipedia.
The text is licensed under Creative Commons - Attribution - Sharealike.
Additional terms may apply for the media files.