Qingliu County
| Qingliu County 清流县 | |
|---|---|
| County | |
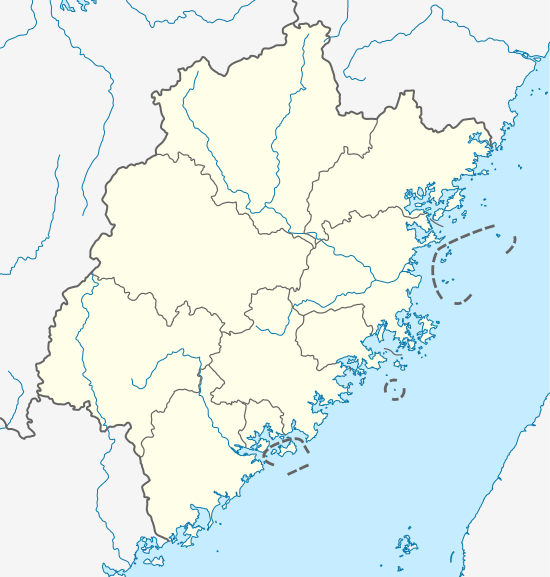 Qingliu Location of the seat in Fujian | |
| Coordinates: 26°10′41″N 116°49′01″E / 26.178°N 116.817°ECoordinates: 26°10′41″N 116°49′01″E / 26.178°N 116.817°E | |
| Country | People's Republic of China |
| Province | Fujian |
| Prefecture-level city | Sanming |
| Time zone | UTC+8 (China Standard) |
Qingliu (simplified Chinese: 清流县; traditional Chinese: 清流縣; pinyin: Qīngliú Xiàn) is a county of western Fujian province, People's Republic of China. It is under the administration of Sanming City.
Administration
The county executive, legislature, and judiciary are in Longjin (龙津) Town, along with the CPC and PSB branches.
Other Towns (镇, zhen)
- Songxi (嵩溪)
- Songkou (嵩口)
- Changjiao (长校)
- Lingdi (灵地)
Township (乡, xiang)
- Donghua (东华)
- Linshe (林畲)
- Wenjiao (温郊)
- Sheming (佘明)
- Tianyuan (田源)
- Litian (里田)
- Shawu (沙芜)
- Laifang (赖坊)
- Dengjia (邓家)
- Lijia (李家)
Climate
| Climate data for Qingliu (1981−2010) | |||||||||||||
|---|---|---|---|---|---|---|---|---|---|---|---|---|---|
| Month | Jan | Feb | Mar | Apr | May | Jun | Jul | Aug | Sep | Oct | Nov | Dec | Year |
| Record high °C (°F) | 28.0 (82.4) |
31.0 (87.8) |
31.9 (89.4) |
34.3 (93.7) |
35.5 (95.9) |
37.0 (98.6) |
38.8 (101.8) |
39.4 (102.9) |
37.3 (99.1) |
35.7 (96.3) |
32.3 (90.1) |
28.0 (82.4) |
39.4 (102.9) |
| Average high °C (°F) | 14.0 (57.2) |
15.5 (59.9) |
18.8 (65.8) |
24.2 (75.6) |
27.9 (82.2) |
30.5 (86.9) |
33.8 (92.8) |
33.2 (91.8) |
30.3 (86.5) |
26.4 (79.5) |
21.4 (70.5) |
16.5 (61.7) |
24.4 (75.9) |
| Daily mean °C (°F) | 7.8 (46) |
9.9 (49.8) |
13.3 (55.9) |
18.5 (65.3) |
22.2 (72) |
25.1 (77.2) |
27.2 (81) |
26.7 (80.1) |
24.1 (75.4) |
19.6 (67.3) |
14.2 (57.6) |
9.0 (48.2) |
18.1 (64.6) |
| Average low °C (°F) | 4.2 (39.6) |
6.4 (43.5) |
9.8 (49.6) |
14.8 (58.6) |
18.5 (65.3) |
21.5 (70.7) |
22.8 (73) |
22.8 (73) |
20.4 (68.7) |
15.5 (59.9) |
10.0 (50) |
4.6 (40.3) |
14.3 (57.7) |
| Record low °C (°F) | −6.9 (19.6) |
−4.2 (24.4) |
−4.2 (24.4) |
2.9 (37.2) |
9.0 (48.2) |
12.5 (54.5) |
18.6 (65.5) |
16.3 (61.3) |
10.9 (51.6) |
3.0 (37.4) |
−2.8 (27) |
−8.9 (16) |
−8.9 (16) |
| Average precipitation mm (inches) | 71.6 (2.819) |
130.3 (5.13) |
219.5 (8.642) |
224.7 (8.846) |
293.7 (11.563) |
303.7 (11.957) |
147.2 (5.795) |
160.5 (6.319) |
101.9 (4.012) |
65.4 (2.575) |
52.8 (2.079) |
48.1 (1.894) |
1,819.4 (71.631) |
| Average relative humidity (%) | 82 | 84 | 85 | 84 | 83 | 83 | 78 | 80 | 84 | 80 | 81 | 81 | 82 |
| Source: China Meteorological Data Service Center | |||||||||||||
This article is issued from
Wikipedia.
The text is licensed under Creative Commons - Attribution - Sharealike.
Additional terms may apply for the media files.