Puttur, Karnataka
| Puttur | |
|---|---|
| City | |
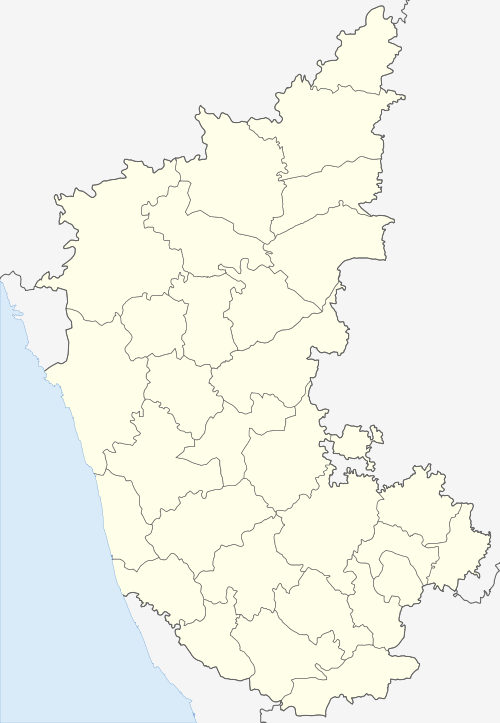 Puttur Location in India | |
| Coordinates: 12°45′53″N 75°11′03″E / 12.7648°N 75.1842°ECoordinates: 12°45′53″N 75°11′03″E / 12.7648°N 75.1842°E | |
| Country |
|
| State | Karnataka |
| Region | Coastal Karnataka |
| District | Dakshina Kannada |
| Named for |
Muttu (Pearl) or Posath ooru(New city) |
| Government | |
| • Body | Municipal council |
| • MLA | Sanjeeva Matandoor(BJP) |
| Elevation | 87 m (285 ft) |
| Population (2011)[1] | |
| • Total | 287,851 |
| Time zone | UTC+5:30 (IST) |
| PIN | 574201, 574202, 574203,574210 |
| Telephone code | 8251 |
| ISO 3166 code | IN-KA |
| Vehicle registration | KA 21 |
| Website | Official website |
Puttur is a city in Dakshina Kannada district, in Karnataka state of India. It is the headquarters of the Puttur taluk.
Geography
Puttur is located at 12°45′53″N 75°11′03″E / 12.7648°N 75.1842°E.[2] It has an average elevation of 87 m (300 ft). Puttur is situated 52 km (32 mi) south-east of Mangalore city. A small part of the Western Ghats touches Puttur town. There is a famous hill here in Puttur called Birumala Gudde and a historical Mahalingeshwara temple said to be over 800 years old. There is also a famous park of Dr. Shivarama Karanth.
Demographics
As of 2011 India census,[3] Puttur had a population of 48,063. Males constitute 50% of the population and females 50%. Hinduism is the major religion constitute 65%, Muslims are about 22%, Christianity constitute 6% and other religions constitute 7%. The average literacy rate is 79%, which is higher than the national average of 59.5%: male literacy is 83%, and female literacy is 75%. About 11% of the population is under 6 years of age.
Climate
| Climate data for Puttur, India | |||||||||||||
|---|---|---|---|---|---|---|---|---|---|---|---|---|---|
| Month | Jan | Feb | Mar | Apr | May | Jun | Jul | Aug | Sep | Oct | Nov | Dec | Year |
| Average high °C (°F) | 31.3 (88.3) |
31.8 (89.2) |
32.7 (90.9) |
33.1 (91.6) |
32.4 (90.3) |
29.3 (84.7) |
28.0 (82.4) |
28.2 (82.8) |
28.8 (83.8) |
29.9 (85.8) |
30.8 (87.4) |
31.2 (88.2) |
30.6 (87.1) |
| Daily mean °C (°F) | 26 (79) |
26.9 (80.4) |
28.1 (82.6) |
29.1 (84.4) |
28.8 (83.8) |
26.4 (79.5) |
25.5 (77.9) |
25.6 (78.1) |
25.9 (78.6) |
26.5 (79.7) |
26.6 (79.9) |
26.1 (79) |
26 (79) |
| Average low °C (°F) | 20.8 (69.4) |
22.0 (71.6) |
23.6 (74.5) |
25.2 (77.4) |
25.2 (77.4) |
23.5 (74.3) |
23.0 (73.4) |
23.1 (73.6) |
23.0 (73.4) |
23.2 (73.8) |
22.4 (72.3) |
21.0 (69.8) |
21 (70) |
| Average rainfall mm (inches) | 0 (0) |
1 (0.04) |
6 (0.24) |
63 (2.48) |
208 (8.19) |
938 (36.93) |
1,489 (58.62) |
858 (33.78) |
386 (15.2) |
277 (10.91) |
81 (3.19) |
22 (0.87) |
4,329 (170.45) |
| Source: Climate-Data.org - Climate Table of Puttur, Karnataka, India[4] | |||||||||||||
References
- ↑ "Census of India Search details". censusindia.gov.in. Retrieved 10 May 2015.
- ↑ Falling Rain Genomics, Inc - Puttur
- ↑ "Census of India 2001: Data from the 2001 Census, including cities, villages and towns (Provisional)". Census Commission of India. Archived from the original on 2004-06-16. Retrieved 2008-11-01.
- ↑ "Climate Table of Puttur, Karnataka, India". Climate-Data.org. Retrieved 31 January 2015.
External links
| Wikimedia Commons has media related to Puttur, Karnataka. |