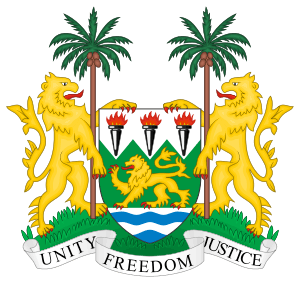
Politics of Sierra Leone
 |
|---|
| This article is part of a series on the politics and government of Sierra Leone |
|
Legislative
|
|
Sierra Leone is a country located in West Africa, known officially as the Republic of Sierra Leone.
Government of Sierra Leone
The government of Sierra Leone is the governing authority of the Republic of Sierra Leone, as established by the Sierra Leone Constitution. The Sierra Leone government is divided into three branches: the executive, legislative and the judicial. The seat of government of Sierra Leone is in the capital Freetown. The Economist Intelligence Unit has rated Sierra Leone as "hybrid regime" in 2016.[1]
Administrative divisions
Sierra Leone is divided into provinces, districts, and chiefdoms. Sierra Leone has 3 rural provinces, plus a capital city administrative province. There are then 14 districts - 12 rural, 2 for the capital Freetown.
Sierra Leone is further divided into 149 chiefdoms.[2] The chiefdoms are hereditary, tribal units of local governance.[2] The World Bank sponsored the creation of elected local councils in 2004.[2]
Political parties and elections
| Candidate | Party | 1st round | 2nd round | ||
|---|---|---|---|---|---|
| Votes | % | Votes | % | ||
| Ernest Bai Koroma | All People's Congress (APC) | 815,523 | 44.34% | 950,407 | 54.62% |
| Solomon Berewa | Sierra Leone People's Party (SLPP) | 704,012 | 38.28% | 789,651 | 45.38% |
| Charles Margai | People's Movement for Democratic Change (PMDC) | 255,499 | 13.89% | ||
| Andrew Turay | Convention People's Party (CPP) | 28,610 | 1.56% | ||
| Amadu Jalloh | National Democratic Alliance (NDA) | 17,748 | 0.96% | ||
| Kandeh Baba Conteh | Peace and Liberation Party (PLP) | 10,556 | 0.57% | ||
| Abdul Kady Karim | United National People's Party (UNPP) | 7,260 | 0.39% | ||
| Total: (turnout 75.8%) | 1,839,208 | 100.00% | 1,740,058 | 100.00% | |
| Source: National Electoral Commission (first round), National Electoral Commission (second round) | |||||
| Parties | Votes | % | Seats | ||
|---|---|---|---|---|---|
| All People's Congress | 728,898 | 40.73% | 59 | ||
| Sierra Leone People's Party | 707,608 | 39.54% | 43 | ||
| People's Movement for Democratic Change | 275,435 | 15.39% | 10 | ||
| National Democratic Alliance | 31,388 | 1.75% | 0 | ||
| Convention People's Party | 15,303 | 0.86% | 0 | ||
| United National People's Party | 14,078 | 0.79% | 0 | ||
| Independents | 10,127 | 0.57% | 0 | ||
| Peace and Liberation Party | 6,752 | 0.38% | 0 | ||
| Traditional chiefs | — | 12 | |||
| Total | 1,789,589 | 100.00% | 124 | ||
| Invalid (8.94% of all votes) | 175,606 | ||||
| Total including invalid votes | 1,965,195 | ||||
| Source: National Electoral Commission (seats and votes per constituency) The traditional chiefs elected twelve MPs independently from the parliamentary | |||||
See also
References
- ↑ solutions, EIU digital. "Democracy Index 2016 - The Economist Intelligence Unit". www.eiu.com. Retrieved 2017-12-01.
- 1 2 3 Tristan Reed and James A. Robinson, The Chiefdoms of Sierra Leone, Scholar, Harvard University, 15 July 2013, Document available online, accessed 30 April 2014
External links
- Office of the Sierra Leone President
- Sierra Leone Government
- Special Court for Sierra Leone
- Truth and Reconciliation Commission
Elections
- African Elections Database
- https://books.google.com/books?id=jj4J-AXGDaQC&pg=PA983&lpg=PA983&dq=state+avenue+state+house+in+freetown+closed+to+public&source=bl&ots=JIlbx4olxv&sig=HFzmpvbA28Y_pq80DGPuaXG_nQo&hl=en&ei=j5ykTeuOIMaw0QHjrp2DCQ&sa=X&oi=book_result&ct=result&resnum=1&ved=0CBgQ6AEwAA#v=onepage&q&f=false