Photothermal microspectroscopy
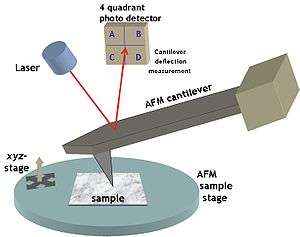
Photothermal microspectroscopy (PTMS), alternatively known as photothermal temperature fluctuation (PTTF),[1][2] is derived from two parent instrumental techniques: infrared spectroscopy and atomic force microscopy (AFM). In one particular type of AFM, known as scanning thermal microscopy (SThM), the imaging probe is a sub-miniature temperature sensor, which may be a thermocouple or a resistance thermometer.[3] This same type of detector is employed in a PTMS instrument, enabling it to provide AFM/SThM images: However, the chief additional use of PTMS is to yield infrared spectra from sample regions below a micrometer, as outlined below.
Technique
The AFM is interfaced with an infrared spectrometer. For work using Fourier transform infrared spectroscopy (FTIR), the spectrometer is equipped with a conventional black body infrared source. A particular region of the sample may first be chosen on the basis of the image obtained using the AFM imaging mode of operation. Then, when material at this location absorbs the electromagnetic radiation, heat is generated, which diffuses, giving rise to a decaying temperature profile. The thermal probe then detects the photothermal response of this region of the sample. The resultant measured temperature fluctuations provide an interferogram that replaces the interferogram obtained by a conventional FTIR setup, e.g., by direct detection of the radiation transmitted by a sample. The temperature profile can be made sharp by modulating the excitation beam. This results in the generation of thermal waves whose diffusion length is inversely proportional to the root of the modulation frequency. An important advantage of the thermal approach is that it permits to obtain depth-sensitive subsurface information from surface measurement, thanks to the dependence of thermal diffusion length on modulation frequency.
Applications
The two particular features of PTMS that have determined its applications so far are 1) spectroscopic mapping may be performed at a spatial resolution well below the diffraction limit of IR radiation, ultimately at a scale of 20-30 nm. In principle, this opens the way to sub-wavelength IR microscopy (see scanning probe microscopy) where the image contrast is to be determined by the thermal response of individual sample regions to particular spectral wavelengths and 2) in general, no special preparation technique is required when solid samples are to be studied. For most standard FTIR methods, this is not the case.
Related technique
This spectroscopic technique complements another recently developed method of chemical characterisation or fingerprinting, namely micro-thermal analysis (micro-TA).[4][5] This also uses an “active” SThM probe, which acts as a heater as well as a thermometer, so as to inject evanescent temperature waves into a sample and to allow sub-surface imaging of polymers and other materials. The sub-surface detail detected corresponds to variations in heat capacity or thermal conductivity. Ramping the temperature of the probe, and thus the temperature of the small sample region in contact with it, allows localized thermal analysis and/or thermomechanometry to be performed.
References
- ↑ Hammiche, A.; Pollock, H. M.; Reading, M.; Claybourn, M.; et al. (1999). "Photothermal FT-IR Spectroscopy: A Step Towards FT-IR Microscopy at a Resolution Better Than the Diffraction Limit". Applied Spectroscopy. 53 (7): 810. Bibcode:1999ApSpe..53..810H. doi:10.1366/0003702991947379.
- ↑ H M Pollock & D A Smith (2002). "The use of near-field probes for vibrational spectroscopy and photothermal imaging". In J.M. Chalmers & P.R. Griffiths. Handbook of vibrational spectroscopy. 2. John Wiley & Sons. pp. 1472–1492.
- ↑ Majumdar, A. (1999). "Scanning thermal microscopy". Annual Review of Materials Science. 29: 505. Bibcode:1999AnRMS..29..505M. doi:10.1146/annurev.matsci.29.1.505.
- ↑ H. M. Pollock & A. Hammiche (2001). "Micro-thermal analysis: techniques and applications". J Phys D. 34 (9): R23–R53. Bibcode:2001JPhD...34R..23P. doi:10.1088/0022-3727/34/9/201.
- ↑ J. Ye; et al. (2007). "Scanning thermal probe microscopy: nano thermal analysis with Raman microscopy". Microscopy and Analysis: S5–S8. Archived from the original on 2011-07-14.
Further reading
- F L Martin & H M Pollock (2010). "Microspectroscopy as a tool to discriminate nano-molecular cellular alterations in biomedical research". In A V Narlikar & Y Y Fu. Oxford Handbook of Nanoscience and Technology vol. 2. pp. 285–336.
- Hammiche, A; German, MJ; Hewitt, R; Pollock, HM; et al. (2005). "Monitoring Cell Cycle Distributions in MCF-7 Cells Using Near-Field Photothermal Microspectroscopy". Biophysical Journal. 88 (5): 3699–706. Bibcode:2005BpJ....88.3699H. doi:10.1529/biophysj.104.053926. PMC 1305516. PMID 15722424.
- Grude, Olaug; Hammiche, Azzedine; Pollock, Hubert; Bentley, Adam J.; et al. (2007). "Near-field photothermal microspectroscopy for adult stem-cell identification and characterization". Journal of Microscopy. 228 (Pt 3): 366–72. doi:10.1111/j.1365-2818.2007.01853.x. PMID 18045331.
- M. J. Walsh; et al. (2008). "FTIR micro-spectroscopy identifies symmetric PO2- modifications as a marker of the putative stem cell region of human intestinal crypts". Stem Cells. 26 (1): 108–118. doi:10.1634/stemcells.2007-0196. PMID 17901405.
- Grude, O; Nakamura, T; Hammiche, A; Bentley, A; et al. (2009). "Discrimination of human stem cells by photothermal microspectroscopy". Vibrational Spectroscopy. 49: 22. doi:10.1016/j.vibspec.2008.04.008.
- A Hammiche; et al. (2004). "Mid-infrared micro-spectroscopy of difficult samples using near-field PhotoThermal Micro-Spectroscopy (PTMS)" (PDF). Spectroscopy. 19: 20–42. , erratum in 19(5), 14 (2004)
- J. G. Kelly; et al. (2011). "Biospectroscopy to metabolically profile biomolecular structure: a multi-stage approach linking computational analysis with biomarkers". J Proteome Res. 10 (4): 1437–48. doi:10.1021/pr101067u. PMID 21210632.
- H.M. Pollock (2011). "Towards chemical mapping at sub-micron resolution: near-field spectroscopic delineation of interphase boundaries". Materials Science Forum. 662: 1–11. doi:10.4028/www.scientific.net/msf.662.1.
- H M Pollock; S G Kazarian (2014). "Microspectroscopy in the Mid-Infrared". In R A Meyers. Encyclopedia of Analytical Chemistry. pp. 1–26.
- L Bozec; et al. (2001). "Localized photothermal infrared spectroscopy using a proximal probe". J Appl Phys. 90: 5159–65. Bibcode:2001JAP....90.5159B. doi:10.1063/1.1403671.
- M J German; et al. (2006). "IR spectroscopy with multivariate analysis potentially facilitates the segregation of different types of prostate cell,". Biophysical Journal. 90 (10): 3783–3795. Bibcode:2006BpJ....90.3783G. doi:10.1529/biophysj.105.077255.
- A M Katzenmeyer; et al. (2015). "Mid-infrared spectroscopy beyond the diffraction limit via direct measurement of the photothermal effect†,". Nanoscale. 7: 17637. Bibcode:2015Nanos...717637K. doi:10.1039/c5nr04854k.
- P M Donaldson; et al. (2016). "Broadband near-field infrared spectromicroscopy using photothermal probes and synchrotron radiation,". Optics Express. 24 (3): 1852–1864. Bibcode:2016OExpr..24.1852D. doi:10.1364/oe.24.001852.