Norwegian Parliamentary election, 1997

|
|
|
All 165 seats to the Norwegian Parliament
83 seats were needed for a majority |
|---|
| |
First party |
Second party |
Third party |
| |
 |
 |
 |
| Leader |
Thorbjørn Jagland |
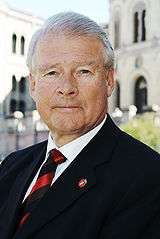
Carl I. Hagen |
Valgerd Svarstad Haugland |
| Party |
Labour |
Progress |
Christian Democratic |
| Last election |
67 seats, 36.9% |
10 seats, 6.3% |
13 seats, 7.9% |
| Seats won |
65 |
25 |
25 |
| Seat change |
 2 2 |
 15 15 |
 12 12 |
| Popular vote |
904,362 |
395,376 |
353,082 |
| Percentage |
35.0% |
15.3% |
13.7% |
|
| |
Fourth party |
Fifth party |
Sixth party |
| |
 |
 |
 |
| Leader |
Jan Petersen |
Anne Enger Lahnstein |
Erik Solheim |
| Party |
Conservative |
Centre |
Socialist Left |
| Last election |
28 seats, 17.0% |
32 seats, 16.7% |
13 seats, 7.9% |
| Seats won |
23 |
11 |
9 |
| Seat change |
 5 5 |
 21 21 |
 4 4 |
| Popular vote |
370,441 |
204,824 |
155,307 |
| Percentage |
14.3% |
7.9% |
6.0% |
|
| |
Seventh party |
|
| |
 |
|
| Leader |
Lars Sponheim |
|
| Party |
Liberal |
|
| Last election |
1 seat, 3.6% |
|
| Seats won |
6 |
|
| Seat change |
 5 5 |
|
| Popular vote |
115,077 |
|
| Percentage |
4.5% |
|
|
|
Parliamentary elections were held in Norway on 14 and 15 September 1997.[1] Prior to the election Prime Minister Thorbjørn Jagland of the Labour Party had issued the 36.9 ultimatum declaring that the government would step down unless it gained 36.9% of the vote, the percentage gained by the Labour Party in 1993 under Gro Harlem Brundtland. Whilst Labour won a plurality of seats, they were unable to reach Jagland's 36.9% threshold, gaining 35% of the vote.
As a result of this, the Labour government stepped down, being replaced by a centrist coalition of the Christian People's Party, Liberal Party and the Centre Party, with Kjell Magne Bondevik being appointed Prime Minister, and confidence and supply support from the right-wing Progress and Conservative Party.
Results
 |
|---|
| Party |
Votes |
% |
Seats |
+/– |
| Labour Party | 904,362 | 35.0 | 65 | –2 |
| Progress Party | 395,376 | 15.3 | 25 | +15 |
| Conservative Party | 370,441 | 14.3 | 23 | –5 |
| Christian People's Party | 353,082 | 13.7 | 25 | +12 |
| Centre Party | 204,824 | 7.9 | 11 | –21 |
| Socialist Left Party | 155,307 | 6.0 | 9 | –4 |
| Liberal Party | 115,077 | 4.5 | 6 | +5 |
| Red Electoral Alliance | 43,252 | 1.7 | 0 | –1 |
| Pensioners' Party | 16,031 | 0.6 | 0 | 0 |
| Non-Partisan Deputies | 9,195 | 0.4 | 1 | +1 |
| Environment Party The Greens | 5,884 | 0.2 | 0 | 0 |
| Fatherland Party | 3,805 | 0.2 | 0 | 0 |
| Natural Law Party | 2,207 | 0.1 | 0 | 0 |
| Communist Party | 1,979 | 0.1 | 0 | 0 |
| Christian Conservative Party | 1,386 | 0.1 | 0 | 0 |
| New Future Coalition Party | 491 | 0.0 | 0 | 0 |
| White Electoral Alliance | 463 | 0.0 | 0 | New |
| Justice Party | 281 | 0.0 | 0 | New |
| Liberal People's Party | 258 | 0.0 | 0 | 0 |
| Children-Elderly | 246 | 0.0 | 0 | New |
| Society Party | 214 | 0.0 | 0 | 0 |
| Invalid/blank votes | 9,508 | – | – | – |
| Total | 2,593,669 | 100 | 165 | 0 |
| Registered voters/turnout | 3,311,190 | 78.3 | – | – |
| Source: Nohlen & Stöver, European Elections Database |
References
- ↑ Dieter Nohlen & Philip Stöver (2010) Elections in Europe: A data handbook, p1438
ISBN 978-3-8329-5609-7


