Norwegian parliamentary election, 1981
|
|
|
All 155 seats in the Norwegian Parliament
78 seats were needed for a majority |
|---|
| |
First party |
Second party |
Third party |
| |
 |
 |
.JPG) |
| Leader |
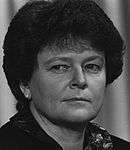
Gro Harlem Brundtland |
Jo Benkow |
Kåre Kristiansen |
| Party |
Labour |
Conservative |
Christian Democratic |
| Last election |
76 seats, 42.3% |
41 seats, 24.5% |
22 seats, 9.7% |
| Seats won |
66 |
53 |
15 |
| Seat change |
 10 10 |
 12 12 |
7 |
| Popular vote |
914,749 |
780,372 |
219,179 |
| Percentage |
37.2% |
31.7% |
8.9% |
|
| |
Fourth party |
Fifth party |
Sixth party |
| |
.jpg) |
 |
 |
| Leader |
Johan J. Jakobsen |
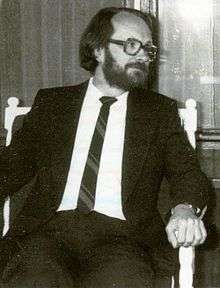
Berge Furre |
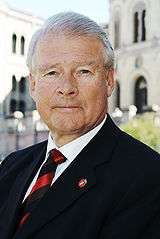
Carl I. Hagen |
| Party |
Centre |
Socialist Left |
Progress |
| Last election |
12 seats, 8.0% |
2 seats, 4.2% |
0 seats, 1.9% |
| Seats won |
11 |
4 |
4 |
| Seat change |
1 |
2 |
4 |
| Popular vote |
103,753 |
121,561 |
109,564 |
| Percentage |
4.2% |
4.9% |
4.5% |
|
| |
Seventh party |
|
| |
|
|
| Leader |
Hans Hammond Rossbach |
|
| Party |
Liberal |
|
| Last election |
2 seats, 2.4% |
|
| Seats won |
2 |
|
| Seat change |
 0 0 |
|
| Popular vote |
79,064 |
|
| Percentage |
3.2% |
|
|
|
Parliamentary elections were held in Norway on 13 and 14 September 1981.[1] The Labour Party remained the largest party in the Storting, winning 66 of the 155 seats. The Conservative Party made the strongest gains and formed a government on its own. In 1983 a majority coalition government with the Christian People's Party and the Center Party was established.
Results
 |
|---|
| Party |
Votes |
% |
Seats |
+/– |
| Labour Party | 914,749 | 37.2 | 66 | –10 |
| Conservative Party | 780,372 | 31.7 | 53 | +12 |
| Christian People's Party | 219,179 | 8.9 | 15 | –7 |
| Socialist Left Party | 121,561 | 4.9 | 4 | +2 |
| Progress Party | 109,564 | 4.5 | 4 | +4 |
| Centre Party | 103,753 | 4.2 | 11 | –1 |
| Non-socialist joint lists | 88,969 | 3.6 | [a] | – |
| Liberal Party | 79,064 | 3.2 | 2 | 0 |
| Red Electoral Alliance | 17,844 | 0.7 | 0 | 0 |
| Liberal People's Party | 13,344 | 0.5 | 0 | 0 |
| Communist Party | 6,673 | 0.3 | 0 | 0 |
| Plebiscite Party | 1,145 | 0.0 | 0 | New |
| Tom A. Schanke's Party | 826 | 0.0 | 0 | New |
| Freely Elected Representatives | 801 | 0.0 | 0 | 0 |
| Lapp People's List | 594 | 0.0 | 0 | 0 |
| Broad-Based Non-Partisan List | 383 | 0.0 | 0 | New |
| Invalid/blank votes | 3,387 | – | – | – |
| Total | 2,462,142 | 100 | 155 | 0 |
| Registered voters/turnout | 3,003,093 | 82.0 | – | – |
| Source: Nohlen & Stöver |
a Five seats were won by joint lists, all of which were taken by the Centre Party.[2]
References
- ↑ Dieter Nohlen & Philip Stöver (2010) Elections in Europe: A data handbook, p1438
ISBN 978-3-8329-5609-7
- ↑ Nohlen & Stöver, p1460