Fleetwood—Port Kells
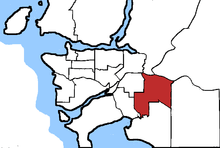 Fleetwood—Port Kells in relation to other federal electoral districts in Vancouver | |||
| Federal electoral district | |||
| Legislature | House of Commons | ||
| MP |
Liberal | ||
| District created | 2003 | ||
| First contested | 2004 | ||
| Last contested | 2015 | ||
| District webpage | profile, map | ||
| Demographics | |||
| Population (2011)[1] | 109,742 | ||
| Electors (2015) | 72,487 | ||
| Area (km²)[1] | 74 | ||
| Pop. density (per km²) | 1,483 | ||
| Census subdivisions | Surrey, Greater Vancouver A | ||
Fleetwood—Port Kells is a federal electoral district in the province of British Columbia, Canada, that has been represented in the House of Commons of Canada since 2004.
Geography
It consists of the northeast part of the City of Surrey, Barnston Island, and Barnston Island Indian Reserve No. 3 the Greater Vancouver Regional District. The communities of Fleetwood, East Newton, Fraser Heights, Port Kells and North Clayton are contained within this riding.
Demographics
- According to the Canada 2011 Census[2]
Ethnic groups: 36.0% White, 27.1% South Asian, 11.1% Chinese, 9.3% Filipino, 4.5% Southeast Asian, 4.2% Korean, 1.3% Black, 1.2% Indigenous, 1.1% Latino, 4.2% Other
Languages: 46.9% English, 17.6% Punjabi, 8.8% Chinese, 4.9% Tagalog, 4.0% Korean, 2.8% Vietnamese, 2.3% Hindi, 1.1% Spanish, 11.6% Other
Religions: 43.0% Christian, 19.6% Sikh, 3.7% Muslim, 3.6% Buddhist, 3.3% Hindu, 0.4% Other, 26.4% None
Median income: $26,124 (2010)
Average income: $34,327 (2010)
History
The electoral district was created in 2003 from Surrey Central and some of Surrey North riding.
The 2012 federal electoral boundaries redistribution concluded that the electoral boundaries of Fleetwood—Port Kells should be adjusted, and a modified electoral district of the same name will be contested in future elections.[3] The redefined Fleetwood—Port Kells gains very small areas from the current ridings of Surrey North and South Surrey—White Rock—Cloverdale while losing significant portions of its current territory to the new districts of Cloverdale—Langley City, South Surrey—White Rock and Surrey—Newton. These new boundaries were legally defined in the 2013 representation order, which came into effect upon the call of the 42nd Canadian federal election, scheduled for October 2015.[4]
Members of Parliament
| Parliament | Years | Member | Party | |
|---|---|---|---|---|
| Fleetwood—Port Kells Riding created from Surrey Central and Surrey North |
||||
| 38th | 2004–2006 | Nina Grewal | Conservative | |
| 39th | 2006–2008 | |||
| 40th | 2008–2011 | |||
| 41st | 2011–2015 | |||
| 42nd | 2015–Present | Ken Hardie | Liberal | |
Election results
| Canadian federal election, 2015 | ||||||||
|---|---|---|---|---|---|---|---|---|
| Party | Candidate | Votes | % | ±% | Expenditures | |||
| Liberal | Ken Hardie | 22,871 | 46.90 | +31.24 | $50,601.97 | |||
| Conservative | Nina Grewal | 14,275 | 29.27 | -18.56 | $77,785.90 | |||
| New Democratic | Garry Begg | 10,463 | 21.46 | -11.60 | $100,039.24 | |||
| Green | Richard Hosein | 1,154 | 2.37 | -0.20 | $3,625.85 | |||
| Total valid votes/Expense limit | 48,763 | 100.00 | $206,797.64 | |||||
| Total rejected ballots | 269 | 0.55 | – | |||||
| Turnout | 49,032 | 65.25 | – | |||||
| Eligible voters | 75,150 | |||||||
| Liberal gain from Conservative | Swing | +24.90 | ||||||
| Source: Elections Canada[5][6][7] | ||||||||
| 2011 federal election redistributed results[8] | |||
|---|---|---|---|
| Party | Vote | % | |
| Conservative | 16,541 | 47.83 | |
| New Democratic | 11,433 | 33.06 | |
| Liberal | 5,416 | 15.66 | |
| Green | 886 | 2.56 | |
| Others | 306 | 0.88 | |
| Canadian federal election, 2011 | ||||||||
|---|---|---|---|---|---|---|---|---|
| Party | Candidate | Votes | % | ±% | Expenditures | |||
| Conservative | Nina Grewal | 23,950 | 47.5 | +2.8 | ||||
| New Democratic | Nao Fernando | 16,533 | 32.8 | +10.0 | ||||
| Liberal | Pam Dhanoa | 8,041 | 16.0 | -10.1 | ||||
| Green | Alan Saldanha* | 1,476 | 2.9 | -3.5 | ||||
| Libertarian | Alex Joehl | 370 | 0.7 | – | ||||
| Total valid votes/Expense limit | 50,370 | 100.0 | – | |||||
| Total rejected ballots | 266 | 0.5 | 0.0 | |||||
| Turnout | 50,636 | 53.7 | -2 | |||||
| Eligible voters | 94,302 | – | – | |||||
- * Alan Saldanha withdrew after a controversial quote on Facebook.
| Canadian federal election, 2008 | ||||||||
|---|---|---|---|---|---|---|---|---|
| Party | Candidate | Votes | % | ±% | Expenditures | |||
| Conservative | Nina Grewal | 21,389 | 44.7 | +11.2 | $79,909 | |||
| Liberal | Brenda Locke | 12,502 | 26.1 | -5.5 | $75,331 | |||
| New Democratic | Nao Fernando | 10,916 | 22.8 | -2.4 | $65,022 | |||
| Green | Brian Newbold | 3,045 | 6.4 | +4.0 | -- | |||
| Total valid votes/Expense limit | 47,852 | 100.0 | $88,579 | |||||
| Total rejected ballots | 219 | 0.5 | +0.2 | |||||
| Turnout | 48,071 | 56 | +3 | |||||
| Canadian federal election, 2006 | ||||||||
|---|---|---|---|---|---|---|---|---|
| Party | Candidate | Votes | % | ±% | Expenditures | |||
| Conservative | Nina Grewal | 14,577 | 33.5 | -2.3 | $72,464 | |||
| Liberal | Brenda Locke | 13,749 | 31.6 | +2.1 | $54,768 | |||
| New Democratic | Barry Bell | 10,961 | 25.2 | -2.8 | $18,907 | |||
| Independent | Jack Cook | 3,202 | 7.4 | +7.4 | $75,818 | |||
| Green | Duncan McDonald | 1,059 | 2.4 | -3.9 | -- | |||
| Total valid votes | 43,548 | 100.0 | ||||||
| Total rejected ballots | 127 | 0.3 | -0.3 | |||||
| Turnout | 43,675 | 59 | 0 | |||||
| Conservative | hold | Swing | -2.2 | – | ||||
| Canadian federal election, 2004 | ||||||||
|---|---|---|---|---|---|---|---|---|
| Party | Candidate | Votes | % | ±% | Expenditures | |||
| Conservative | Nina Grewal | 14,052 | 35.8 | – | $67,710 | |||
| Liberal | Gulzar Cheema | 11,568 | 29.5 | – | $69,483 | |||
| New Democratic | Barry Bell | 10,976 | 28.0 | – | $7,669 | |||
| Green | David Walters | 2,484 | 6.3 | – | ||||
| Marxist–Leninist | Joseph Theriault | 167 | 0.4 | – | ||||
| Total valid votes | 39,247 | 100.0 | ||||||
| Total rejected ballots | 218 | 0.6 | ||||||
| Turnout | 39,465 | 59 | ||||||
See also
References
- "(Code 59009) Census Profile". 2011 census. Statistics Canada. 2012. Retrieved 2011-03-06.
- Library of Parliament Riding Profile
- Website of the Parliament of Canada
- Expenditures - 2008
- Expenditures - 2004
Notes
- 1 2 Statistics Canada: 2012
- ↑ http://www12.statcan.gc.ca/nhs-enm/2011/dp-pd/prof/details/page.cfm?Lang=E&Geo1=FED2013&Code1=35064&Data=Count&SearchText=nepean&SearchType=Begins&SearchPR=01&A1=All&B1=All&Custom=&TABID=1
- ↑ Final Report – British Columbia
- ↑ Timeline for the Redistribution of Federal Electoral Districts
- ↑ Elections Canada – Confirmed candidates for Fleetwood—Port Kells, 30 September 2015
- ↑ Official Voting Results - Fleetwood—Port Kells
- ↑ "Elections Canada – Preliminary Election Expenses Limits for Candidates". Archived from the original on August 15, 2015.
- ↑ Pundits' Guide to Canadian Elections