New York's 39th congressional district
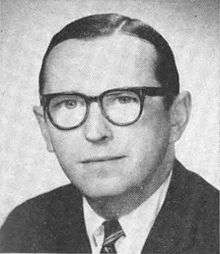
The 39th Congressional District of New York was a congressional district for the United States House of Representatives in New York. It was created in 1913 as a result of the 1910 Census. It was eliminated in 1983 as a result of the 1980 Census. It was last represented by Stanley N. Lundine who was redistricted into the 34th District.
Past Components
1973-1983:
- All of Allegany, Cattaraugus, Chautauqua
- Parts of Chemung, Erie, Steuben
1963-1973:
- Parts of Erie
1953-1963:
1945-1953:
1913-1945:
- All of Genesee, Livingston, Orleans, Wyoming
- Parts of Monroe
Representatives
| Representative | Party | Years | Note |
|---|---|---|---|
| District created | March 4, 1913 | ||
 |
Republican | March 4, 1913 – March 3, 1917 | redistricted from 32nd district |
 |
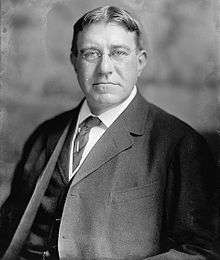
Republican | March 4, 1917 – March 3, 1933 | not a candidate for reelection in 1932 |
 |
Republican | March 4, 1933 – January 3, 1945 | redistricted to 41st district |
 |
Republican | January 3, 1945 – January 3, 1953 | redistricted from 37th district, redistricted to 37th district |
 |
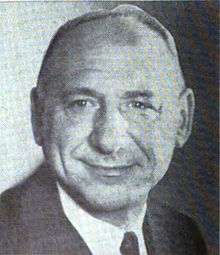
Republican | January 3, 1953 – January 3, 1963 | redistricted from 41st district, redistricted to 37th district |
 |
Republican | January 3, 1963 – January 3, 1965 | redistricted from 42nd district |
 |
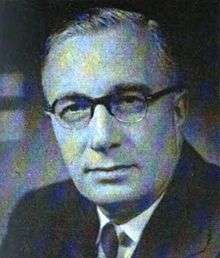
Democratic | January 3, 1965 – January 3, 1971 | Unsuccessful candidate for Democratic U.S. Senate nomination in 1970 |
 |
Republican | January 3, 1971 – January 3, 1973 | redistricted to 38th district |
 |
Republican | January 3, 1973 – January 20, 1976 | redistricted from 38th district, resigned |
vacant |
January 21, 1976 – March 1, 1976 | ||
 |
Democratic | March 2, 1976 – January 3, 1983 | redistricted to 34th district |
| District eliminated | January 3, 1983 | ||
Election results
The following chart shows historic election results. Bold type indicates victor. Italic type indicates incumbent.
| Year | Democratic | Republican | Other |
|---|---|---|---|
| 1980 | Stanley N. Lundine: 93,839 | James Abdella: 75,039 | Genevieve F. Roman (Right to Life): 2,554 |
| 1978 | Stanley N. Lundine: 79,385 | Crispin Maguire: 56,431 | |
| 1976 | Stanley N. Lundine: 109,986 | Richard A. Snowden: 68,018 | |
| 1974 | William L. Parment: 53,866 | James F. Hastings: 87,321 | Joseph V. Damiano (Conservative): 3,832 |
| 1972 | Wilbur White, Jr.: 49,253 | James F. Hastings: 126,147 | |
| 1970 | Thomas P. Flaherty: 90,949 | Jack Kemp: 96,989 | |
| 1968 | Richard D. McCarthy: 120,509 | Daniel E. Weber: 92,589 | John R. Pillion (Conservative): 7,613 |
| 1966 | Richard D. McCarthy: 95,671 | John R. Pillion: 87,230 | |
| 1964 | Richard D. McCarthy: 108,235 | John R. Pillion: 96,934 | |
| 1962 | Angelo S. D'Eloia: 55,774 | John R. Pillion: 99,527 | Walter Bratek (Liberal): 3,661 |
| 1960 | Henry R. Dutcher, Jr.: 69,704 | Harold C. Ostertag: 103,162 | |
| 1958 | Harold L. Rakov: 48,144 | Harold C. Ostertag: 90,004 | |
| 1956 | William H. Mostyn: 48,634 | Harold C. Ostertag: 116,043 | |
| 1954 | George W. Cooke: 45,000 | Harold C. Ostertag: 82,769 | |
| 1952 | O. Richard Judson: 55,483 | Harold C. Ostertag: 107,501 | Michael J. Burke (American Labor): 281 |
| 1950 | Donald J. O'Connor: 31,639 | W. Sterling Cole: 64,377 | Grace W. Hill (American Labor): 1,092 |
| 1948 | Donald J. O'Connor: 37,272 | W. Sterling Cole: 70,659 | Harold Slingerland (American Labor): 2,002 |
| 1946 | William Heidt, Jr.: 23,205 | W. Sterling Cole: 61,330 | |
| 1944 | Charlotte D. Curren: 31,152 | W. Sterling Cole: 75,740 | Julian P. Bretz (American Labor): 4,396 |
| 1942 | James W. Wadsworth, Jr.: 83,195 | ||
| 1940 | J. Frederick Colson: 48,133 | James W. Wadsworth, Jr.: 73,316 | |
| 1938 | J. Frank Gilligan: 28,292 | James W. Wadsworth, Jr.: 65,489 | Edward J. Wagner (American Labor): 5,460 Clair Walbridge (Socialist): 336 |
| 1936 | Donald J. Corbett: 41,699 | James W. Wadsworth, Jr.: 66,869 | Charles A. Lissow (Union): 3,727 Clair Walbridge (Socialist): 1,811 Canio Parrini (Communist): 172 |
| 1934 | David A. White: 36,658 | James W. Wadsworth, Jr.: 49,915 | John Canden Bosch (Socialist): 2,001 Canio Parrini (Communist): 215 |
| 1932 | David A. White: 35,367 | James W. Wadsworth, Jr.: 50,855 | Ernest R. Clark (Law Preservation): 20,209 Martin T. Cook (Socialist): 1,500 |
| 1930 | James M. Dwyer: 29,610 | Archie D. Sanders: 40,069 | William Hilsdorf, Sr. (Socialist): 2,140 |
| 1928 | Frank L. Morris: 34,175 | Archie D. Sanders: 69,615 | George Weber (Socialist): 3,371 |
| 1926 | David A. White: 20,449 | Archie D. Sanders: 48,623 | George Weber (Socialist): 2,714 |
| 1924 | Michael L. Coleman: 23,689 | Archie D. Sanders: 58,165 | George Weber (Socialist): 3,798 |
| 1922 | David A. White: 22,585 | Archie D. Sanders: 37,852 | Clark Allis (Prohibition): 2,100 |
| 1920 | David A. White: 17,602 | Archie D. Sanders: 53,079 | George Weber (Socialist): 3,943 |
References
- Martis, Kenneth C. (1989). The Historical Atlas of Political Parties in the United States Congress. New York: Macmillan Publishing Company.
- Martis, Kenneth C. (1982). The Historical Atlas of United States Congressional Districts. New York: Macmillan Publishing Company.
- Congressional Biographical Directory of the United States 1774–present
- Election Statistics 1920-present Clerk of the House of Representatives
This article is issued from
Wikipedia.
The text is licensed under Creative Commons - Attribution - Sharealike.
Additional terms may apply for the media files.