New York's 35th congressional district
The 35th Congressional District of New York was a congressional district for the United States House of Representatives in New York. It was created in 1903 as a result of the 1900 Census. It was eliminated as a result of the 1980 Census. It was last represented by Barber B. Conable, Jr. who was redistricted into the 30th District.
Past Components
1973-1983:
- All of Genesee, Livingston, Wyoming
- Parts of Monroe, Ontario
1971-1973:
1963-1971:
1953-1963:
- All of Onondaga
1945-1953:
1913-1945:
1903-1913:
- Parts of Buffalo
List of representatives
| Representative | Party | Years | Note |
|---|---|---|---|
| District created | March 4, 1903 | ||
 |
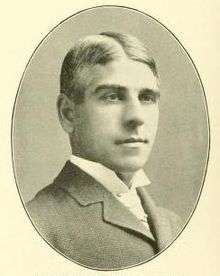
Democratic | March 4, 1903 – March 3, 1909 | redistricted from 32nd district |
.jpg) |
Democratic | March 4, 1909 – March 3, 1913 | redistricted to 42nd district |
.jpg) |
Democratic | March 4, 1913 – March 3, 1915 | |
 |
Republican | March 4, 1915 – May 25, 1927 | died |
vacant |
May 26, 1927 – November 7, 1927 | ||
 |
Republican | November 8, 1927 – January 3, 1945 | redistricted to 36th district |
 |
Republican | January 3, 1945 – January 3, 1949 | redistricted from 32nd district |
.jpg) |
Democratic | January 3, 1949 – January 3, 1951 | |
.jpg) |
Republican | January 3, 1951 – January 3, 1953 | redistricted to 34th district |
 |
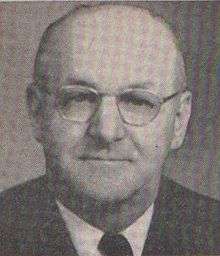
Republican | January 3, 1953 – January 3, 1963 | redistricted from 36th district, redistricted to 34th district |
 |
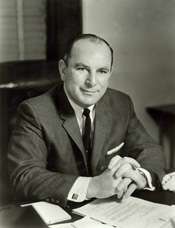
Democratic | January 3, 1963 – January 3, 1971 | redistricted from 32nd district, redistricted to 29th district |
 |
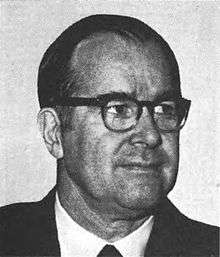
Democratic | January 3, 1971 – January 3, 1973 | redistricted from 34th district, redistricted to 32nd district |
 |
Republican | January 3, 1973 – January 3, 1983 | redistricted from 37th district, redistricted to 30th district |
| District eliminated | January 3, 1983 | ||
Election results
The following chart shows historic election results. Bold type indicates victor. Italic type indicates incumbent.
| Year | Democratic | Republican | Other |
|---|---|---|---|
| 1980 | John M. Owens: 44,754 | Barber B. Conable, Jr.: 127,623 | Bernard M. O'Connor (Right to Life): 3,772 Lydia Bayoneta (Workers World): 625 |
| 1978 | Francis C. Repicci: 36,428 | Barber B. Conable, Jr.: 96,119 | Karen A. Hammel (Conservative): 6,046 |
| 1976 | Michael Macaluso, Jr.: 67,177 | Barber B. Conable, Jr.: 120,738 | |
| 1974 | Margaret Costanza: 63,012 | Barber B. Conable, Jr.: 90,269 | Clarence E. Carman, Jr. (Conservative): 4,667 David L. MacAdam (Liberal): 1,110 |
| 1972 | Terence J. Spencer: 53,321 | Barber B. Conable, Jr.: 127,298 | Terence C. Brennan (Conservative): 4,879 Alicia Burgos (Liberal): 2,082 |
| 1970 | James M. Hanley: 82,425 | John F. O'Connor: 76,381 | |
| 1968 | Samuel S. Stratton: 112,640 | George R. Metcalf: 47,849 | William L. Griffen (Liberal): 1,870 |
| 1966 | Samuel S. Stratton: 93,746 | Frederick D. Dugan: 48,668 | |
| 1964 | Samuel S. Stratton: 110,948 | Robert M. Quigley: 62,463 | |
| 1962 | Samuel S. Stratton: 78,560 | Janet Hill Gordon: 65,697 | |
| 1960 | Jerome M. Wilson: 87,347 | R. Walter Riehlman: 105,241 | Gerard J. Felter (Liberal): 3,144 |
| 1958 | Caryl M. Kline: 77,449 | R. Walter Riehlman: 90,285 | |
| 1956 | Thomas J. Lowery: 59,534 | R. Walter Riehlman: 124,108 | Benjamin Copley (Liberal): 1,465 |
| 1954 | James H. O'Connor: 51,358 | R. Walter Riehlman: 90,002 | Lillian Reiner (American Labor): 290 |
| 1952 | Arthur B. McGuire: 65,763 | R. Walter Riehlman: 113,778 | Lillian Reiner (American Labor): 415 |
| 1950 | John C. Davies: 54,284 | William R. Williams: 60,657 | Ross Maracchion (American Labor): 2,538 |
| 1948 | John C. Davies: 62,855 | Hadwen C. Fuller: 62,717 | Max Meyers (American Labor): 2,964 |
| 1946 | Frank A. Emma: 48,854 | Hadwen C. Fuller: 58,040 | |
| 1944 | Samuel H. Miller, Jr.: 60,025 | Hadwen C. Fuller: 65,857 | |
| 1942 | Arthur B. McGuire: 42,270 | Clarence E. Hancock: 82,021 | Fred Sander (American Labor): 2,934 |
| 1940 | Flora D. Johnson: 69,730 | Clarence E. Hancock: 97,688 | Walter Soule (American Labor): 4,508 |
| 1938 | Caleb C. Brown, Jr.: 50,083 | Clarence E. Hancock: 90,078 | Thomas P. Shallcross (Socialist): 409 |
| 1936 | Arthur R. Perrin: 59,540 | Clarence E. Hancock: 85,702 | Robert H. Anderson (Your): 9,798 Samuel M. Wolfson (Socialist): 2,431 Lempi Makela (Communist): 229 |
| 1934 | Richard P. Byrne: 50,599 | Clarence E. Hancock: 65,732 | Gustave A. Strebel (Socialist): 2,864 Lloyd Roberts (Law Preservation): 649 Sam Belkowitz (Communist): 237 |
| 1932 | Edmund L. Weston: 60,376 | Clarence E. Hancock: 79,345 | Walter B. McNinch (Socialist): 2,950 |
| 1930 | Frederick B. Northrup: 44,336 | Clarence E. Hancock: 63,955 | Henry Hotze (Socialist): 2,695 |
| 1928 | Augustus C. Stevens: 52,926 | Clarence E. Hancock: 90,370 | Charles E. Wheelock (Socialist): 2,910 |
| 1926 | Wilber M. Jones: 36,851 | Walter W. Magee: 62,889 | T. Deck Comerford (Socialist): 1,790 |
| 1924 | John J. Kesel: 35,008 | Walter W. Magee: 70,268 | Frank Heck (Socialist): 3,394 |
| 1922 | Frederick W. Thomson: 37,785 | Walter W. Magee: 47,119 | Fred Sander (Socialist): 2,124 |
| 1920 | John F. Nash: 25,699 | Walter W. Magee: 60,018 | Fred Sander (Socialist): 4,508 Fannie F. Cochran (Prohibition): 2,087 |
References
- Martis, Kenneth C. (1989). The Historical Atlas of Political Parties in the United States Congress. New York: Macmillan Publishing Company.
- Martis, Kenneth C. (1982). The Historical Atlas of United States Congressional Districts. New York: Macmillan Publishing Company.
- Congressional Biographical Directory of the United States 1774–present
- Election Statistics 1920-present Clerk of the House of Representatives
This article is issued from
Wikipedia.
The text is licensed under Creative Commons - Attribution - Sharealike.
Additional terms may apply for the media files.