Nanaimo—Cowichan British Columbia electoral district British Columbia electoral district |
|---|
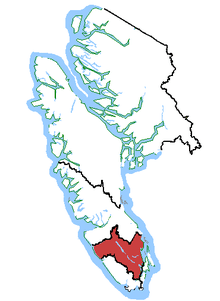 Nanaimo—Cowichan in relation to other Vancouver Island federal electoral districts. |
| Coordinates: |
48°50′10″N 124°03′47″W / 48.836°N 124.063°W / 48.836; -124.063Coordinates: 48°50′10″N 124°03′47″W / 48.836°N 124.063°W / 48.836; -124.063 |
|---|
| Defunct federal electoral district |
|---|
| Legislature |
House of Commons |
|---|
| District created |
1987 |
|---|
| First contested |
1988 |
|---|
| Last contested |
2011 |
|---|
| District webpage |
profile, map |
|---|
| Demographics |
|---|
| Population (2011)[1] |
131,118 |
|---|
| Electors (2011) |
96,034 |
|---|
| Area (km²)[2] |
3,849.38 |
|---|
| Census divisions |
Cowichan Valley, Nanaimo |
|---|
| Census subdivisions |
Nanaimo, North Cowichan, Ladysmith, Duncan, Cowichan Valley A, Cowichan Valley B, Cowichan Valley C, Cowichan Valley E, Nanaimo A, Nanaimo B |
|---|
Nanaimo—Cowichan is a former federal electoral district in British Columbia, Canada, which was represented in the House of Commons of Canada between 1988 and 2015. It was located on Vancouver Island.
Demographics
| Population, 2001 |
116,754 |
| Electors |
86,804 |
| Area (km²) |
|
| Population density (people per km²) |
|
Election results
| Canadian federal election, 2008 |
| Party |
Candidate |
Votes | % | ±% | Expenditures |
|
New Democratic | Jean Crowder | 27,454 | 45.18 | -1.59 | $77,175 |
|
Conservative | Reed Elley | 22,844 | 37.59 | +5.47 | $85,776 |
|
Green | Christina Knighton | 5,816 | 9.56 | +4.48 | $6,368 |
|
Liberal | Brian Scott | 4,483 | 7.37 | -7.94 | $19,279 |
|
Marxist–Leninist | Jack East | 182 | 0.39 | +0.15 | |
| Total valid votes/Expense limit |
60,779 | 100.0 | | $94,753 |
| Total rejected ballots |
156 | 0.26 |
| Turnout |
60,935 | 63.45 |
|
New Democratic hold |
Swing |
-3.53
|
| Canadian federal election, 2006 |
| Party |
Candidate |
Votes | % | ±% | Expenditures |
|
New Democratic | Jean Crowder | 28,558 | 46.77 | +3.06 | $58,554 |
|
Conservative | Norm Sowden | 19,615 | 32.12 | -0.65 | |
|
Liberal | Brian Scott | 9,352 | 15.31 | -0.71 | $14,209 |
|
Green | Harold Henn | 3,107 | 5.08 | -1.53 | $1,476 |
|
Canadian Action | Jeff Warr | 227 | 0.45 | -0.01 | $913 |
|
Marxist–Leninist | Jack East | 148 | 0.24 | – | |
| Total valid votes |
61,057 | 100.0 |
| Total rejected ballots |
135 | 0.22 |
| Turnout |
61,192 |
|
New Democratic hold |
Swing |
+1.86
|
| Canadian federal election, 2004 |
| Party |
Candidate |
Votes | % | ±% | Expenditures |
|
New Democratic | Jean Crowder | 25,243 | 43.71 | +26.75 | $63,401 |
|
Conservative | Dave Quist | 18,928 | 32.77 | -21.04 | $62,967 |
|
Liberal | Lloyd Macilquham | 9,257 | 16.02 | -5.39 | $16,671 |
|
Green | Harold Henn | 3,822 | 6.61 | +4.26 | |
|
Canadian Action | Jeffrey Ian Warr | 270 | 0.46 | -2.49 | |
|
Independent | Brunie Brunie | 229 | 0.39 | – | $635 |
| Total valid votes |
57,749 | 100.0 |
| Total rejected ballots |
147 | 0.25 | -0.07 |
| Turnout |
57,896 | 66.70 |
|
New Democratic gain from Conservative |
Swing |
+23.90
|
| Conservative vote is compared to the total of the Canadian Alliance vote and Progressive Conservative vote in the 2000 election. |
| Canadian federal election, 2000 |
| Party |
Candidate |
Votes | % | ±% | Expenditures |
|
Alliance | Reed Elley | 23,641 | 46.63 | +1.68 | $50,405 |
|
Liberal | Marshall Cooper | 10,857 | 21.41 | +0.28 | $24,987 |
|
New Democratic | Garth Mirau | 8,599 | 16.96 | -9.02 | $33,131 |
|
Progressive Conservative | Cynthia-Mary Hemsworth | 3,640 | 7.18 | +2.96 | $993 |
|
Canadian Action | Doug Catley | 1,500 | 2.95 | +1.53 | $2,916 |
|
Marijuana | Meaghan Walker-Williams | 1,262 | 2.48 | – | |
|
Green | Norm Abbey | 1,196 | 2.35 | +0.52 | $990 |
| Total valid votes |
50,695 | 100.0 |
| Total rejected ballots |
164 | 0.32 | -0.09 |
| Turnout |
50,859 | 64.56 | -0.65 |
|
Alliance hold |
Swing |
+0.70
|
| Canadian Alliance vote is compared to the Reform vote in the 1997 election. |
| Canadian federal election, 1997 |
| Party |
Candidate |
Votes | % | ±% | Expenditures |
|
Reform | Reed Elley | 22,685 | 44.95 | +5.12 | $44,831 |
|
New Democratic | Garth Mirau | 13,112 | 25.98 | +3.53 | $58,293 |
|
Liberal | Michael Garland Coleman | 10,663 | 21.13 | -0.57 | $19,351 |
|
Progressive Conservative | Lindsay Parcells | 2,131 | 4.22 | -4.51 | $4,777 |
|
Green | Karen Margo Shillington | 928 | 1.83 | – | $996 |
|
Canadian Action | Doug Catley | 720 | 1.42 | – | $1,783 |
|
Natural Law | Frank S. James Malaka | 224 | 0.44 | -0.35 | |
| Total valid votes |
50,463 | 100.0 |
| Total rejected ballots |
206 | 0.41 |
| Turnout |
50,669 | 65.21 |
|
Reform hold |
Swing |
+0.80
|