Miles per gallon gasoline equivalent

Miles per gallon gasoline equivalent (MPGe or MPGge) is a measure of the average distance traveled per unit of energy consumed. MPGe is used by the United States Environmental Protection Agency (EPA) to compare energy consumption of alternative fuel vehicles, plug-in electric vehicles and other advanced technology vehicles with the energy consumption[1] of conventional internal combustion vehicles rated in miles per US gallon.[2][3]
MPGe does not necessarily represent an equivalency in the operating costs between alternative fuel vehicles and the MPG rating of internal combustion engine vehicles due to the wide variation in costs for the fuel sources regionally[4][5] since the EPA assumes prices that represents the national averages.[6] Miles per gallon equivalent cost for alternate fuel can be calculated with a simple conversion to the conventional MPG. See conversion to MPG by cost below.
The MPGe metric was introduced in November 2010 by EPA in the Monroney sticker of the Nissan Leaf electric car and the Chevrolet Volt plug-in hybrid. The ratings are based on EPA's formula, in which 33.7 kilowatt-hours (121 megajoules) of electricity is equivalent to one (US) gallon of gasoline,[7] and the energy consumption of each vehicle during EPA's five standard drive cycle tests simulating varying driving conditions.[8][9] All new cars and light-duty trucks sold in the U.S. are required to have this label showing the EPA's estimate of fuel economy of the vehicle.[3]
In a joint ruling issued in May 2011 the National Highway Traffic Safety Administration (NHTSA) and EPA established the new requirements for a fuel economy and environment label that is mandatory for all new passenger cars and trucks starting with model year 2013. This ruling uses miles per gallon gasoline equivalent for all fuel and advanced technology vehicles available in the U.S. market including plug-in hybrids, electric vehicles, flexible-fuel vehicles, hydrogen fuel cell vehicle, natural gas vehicles, diesel-powered vehicles, and gasoline-powered vehicles.[10][11] In addition to being displayed on new vehicles, fuel economy ratings are used by the U.S. Department of Energy (DOE) to publish the annual Fuel Economy Guide; the U.S. Department of Transportation (DOT) to administer the Corporate Average Fuel Economy (CAFE) program; and the Internal Revenue Service (IRS) to collect gas guzzler taxes.[3]
Fuel economy estimates for window stickers and CAFE standard compliance are different. The EPA MPGe rating shown in the Monroney label is based on the consumption of the on-board energy content stored in the fuel tank or in the vehicle's battery, or any other energy source, and only represents the tank-to-wheel energy consumption. CAFE estimates are based on a well-to-wheel basis and in the case of liquid fuels and electric drive vehicles also account for the energy consumed upstream to produce the fuel or electricity and deliver it to the vehicle. Fuel economy for CAFE purposes include an incentive adjustment for alternative fuel vehicles and plug-in electric vehicles which results in higher MPGe than those estimated for window stickers.[12][13]
Background
1988: Alternative Motor Fuels Act
The Alternative Motor Fuels Act (AMFA) enacted in 1988 provides Corporate Average Fuel Economy (CAFE) incentives for the manufacture of vehicles that use ethanol, methanol, or natural gas fuels, either powered exclusively on these alternative fuels or in conjunction with gasoline or diesel fuel, such flexible-fuel vehicles. In order to provide incentives for the widespread use of these fuels and to promote the production of alternative fuel vehicles, AMFA allows manufacturers producing alternative fuel vehicles to gain CAFE credits by manufacturing these vehicles, which allows them to raise their overall fleet fuel economy levels to comply with the CAFE standards until the established cap level.[14][15]
Beginning in 1993, manufacturers of qualified alternative fuel vehicles can benefit for their CAFE estimation, by computing the weighted average of the fuel economy of the produced alternative fuel vehicles by dividing the alcohol fuel economy by a factor of 0.15. As an example, a dedicated alternative fuel vehicle that would achieve 15 mpg fuel economy while operating on alcohol would have a CAFE calculated as follows:[15]
FE = (1/0.15)(15) = 100 miles per gallon
For alternative dual-fuel vehicles, an assumption is made that the vehicles would operate 50% of the time on the alternative fuel and 50% of the time on conventional fuel, resulting in a fuel economy that is based on a harmonic average of alternative fuel and conventional fuel. For example, for an alternative dual-fuel model that achieves 15 miles per gallon operating on an alcohol fuel and 25 mpg on the conventional fuel, the resulting CAFE would be:[15]
FE = 1 / [(0.5/25) + (0.5/100)] = 40 miles per gallon
Calculation of fuel economy for natural gas vehicles is similar. For the purposes of this calculation, the fuel economy is equal to the weighted average of the fuel economy while operating on natural gas and while operating on either gasoline or diesel fuel. AMFA specifies the energy equivalency of 100 cubic feet of natural gas to be equal to 0.823 gallons of gasoline, with the gallon equivalency of natural gas to be considered to have a fuel content, similar to that for alcohol fuels, equal to 0.15 gallons of fuel. For example, under this conversion and gallon equivalency, a dedicated natural gas vehicle that achieves 25 miles per 100 cubic feet of natural gas would have a CAFE value as follows:[15]
FE = (25/100) x (100/0.823)(1/0.15) = 203 miles per gallon
The Energy Policy Act of 1992 expanded the definition of alternative fuel to include liquefied petroleum gas, hydrogen, liquid fuels derived from coal and biological materials, electricity and any other fuel that the Secretary of Transportation determines to be substantially non-petroleum based and has environmental and energy security benefits. Beginning in 1993, manufacturers of these other alternative fuel automobiles that meet the qualifying requirements can also benefit for special treatment in the calculation of their CAFE.[15]
1994: Gasoline gallon equivalent
In 1994 the U.S. National Institute of Standards and Technology (NIST) introduced gasoline gallon equivalent (GGE) as a metric for fuel economy for natural gas vehicles. NIST defined a gasoline gallon equivalent (GGE) as 5.660 pounds of natural gas, and gasoline liter equivalent (GLE) as 0.678 kilograms of natural gas.[16]
2000: Petroleum-equivalent fuel economy
Energy efficiency for selected electric cars leased in California between 1996–2003:
| Vehicle | Model year |
Type of battery |
Energy use (kWh/mile) |
Energy efficiency (miles/kWh) |
Energy efficiency MPGe (miles/33.7 kWh) |
|---|---|---|---|---|---|
| GM EV1[17] | 1997 | Lead acid | 0.164 | 6.10 | 205 |
| GM EV1[18] | 1999 | NiMH | 0.179 | 5.59 | 188 |
| Toyota RAV4 EV[19] | 1996 | Lead acid | 0.235 | 4.28 | 143 |
| Toyota RAV4 EV[20] | 2000 | NiMH | 0.400 | 2.50 | 84 |
| Ford Ranger EV[21] | 1998 | Lead acid | 0.337 | 2.98 | 100 |
| Chevrolet S-10 EV[22] | 1997 | Lead acid | 0.292 | 3.42 | 115 |
During the late 1990s and early 2000s several electric cars were produced in limited quantities as a result of the California Air Resources Board (CARB) mandate for more fuel-efficient zero-emissions vehicles. Popular models available in California included the General Motors EV1 and the Toyota RAV4 EV.[23][24] The US DoE and EPA rating for on board energy efficiency for these electric vehicles was expressed as kilowatt-hour/mile (KWh/mi), the most commonly known metric in science and engineering for measuring energy consumption, and used as the billing unit for energy delivered to consumers by electric utilities.[25]
In order to address the Corporate Average Fuel Economy (CAFE) regulations mandated by the US Congress in 1975, the U.S. Department of Energy established in July 2000 a methodology for calculating the petroleum-equivalent fuel economy of electric vehicles on a well-to-wheel basis. The methodology considers the upstream efficiency of the processes involved in the two fuel cycles, including efficiency factors for petroleum refining and distribution, as well as the national average efficiency for electricity generation and transmission.[13] The formula also includes a fuel efficiency incentive factor of 1/0.15 to benefit electric vehicles. This reward factor is intended provide an incentive for vehicle manufactures to produce and sell electric vehicles, as a higher equivalent fuel economy for EVs improves the carmaker overall fleet fuel economy levels in complying with the CAFE standards, and Congress anticipated that such an incentive would help accelerate the commercialization of electric vehicles. The incentive factor chosen by DoE for EVs is the same 1/0.15 factor already applied in the regulatory treatment of other types of alternative fuel vehicles.[13] When all factors are considered in DoE's formula, the energy efficiency or equivalent fuel economy of electric vehicles increases from 33,705 Wh/gallon (plug-to-wheel) to 82,049 Wh/gallon (well-to-wheel).[25]
2007: X Prize
In April 2007, as part of Draft Competition Guidelines released at the New York Auto Show, MPGe was announced as the main merit metric for the Progressive Insurance Automotive X Prize, a competition developed by the X Prize Foundation for super-efficient vehicles that can achieve at least 100 MPGe.[26] In February 2009, Consumer Reports announced that, as part of a partnership with the X Prize Foundation, they planned to report MPGe as one of several measures that will help consumers understand and compare vehicle efficiency for alternative fuel vehicles.[27]
2010–2011: Miles per gallon equivalent

As required by the 2007 Energy Independence and Security Act (EISA), with the introduction of advanced-technology vehicles in the U.S. new information should be incorporated in the Monroney label of new cars and light-duty trucks sold in the country, such as ratings on fuel economy, greenhouse gas emissions, and other air pollutants. The U.S. Environmental Protection Agency and the National Highway Traffic Safety Administration (NHTSA) have conducted a series of studies to determine the best way to redesign this label to provide consumers with simple energy and environmental comparisons across all vehicles types, including battery electric vehicles (BEV), plug-in hybrid electric vehicles (PHEV), and conventional internal combustion engine vehicles powered by gasoline and diesel, in order to help consumers choose more efficient and environmentally friendly vehicles. These changes were proposed to be introduced in new vehicles beginning with model year 2012.[3][28]
The EPA rating for on board energy efficiency for electric vehicles before 2010 was expressed as kilowatt-hour per 100 miles (kW-h/100 mi).[25][29] The window sticker of the 2009 Mini E showed an energy consumption of 33 kW-h/100 mi for city driving and 36 kW-h/100 mi on the highway, technically equivalent to 102 mpg city and 94 mpg highway.[29] The 2009 Tesla Roadster was rated 32 kW-h/100 mi in city and 33 kW-h/100 mi on the highway, equivalent to 105 mpg city and 102 mpg highway.[30][31]
As part of the research and redesign process, EPA conducted focus groups where participants were presented with several options to express the consumption of electricity for plug-in electric vehicles. The research showed that participants did not understand the concept of a kilowatt hour as a measure of electric energy use despite the use of this unit in their monthly electric bills. Instead, participants favored a miles per gallon equivalent, MPGe, as the metric to compare with the familiar miles per gallon used for gasoline vehicles. The research also concluded that the kW-h per 100 miles metric was more confusing to focus group participants compared to a miles per kW-h. Based on these results, EPA decided to use the following fuel economy and fuel consumption metrics on the redesigned labels: MPG (city and highway, and combined); MPGe (city and highway, and combined); Gallons per 100 miles; kW-h per 100 miles.[28]
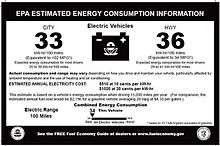
The proposed design and final content for two options of the new sticker label that would be introduced in 2013 model year cars and trucks were consulted for 60 days with the public in 2010, and both include miles per gallon equivalent and kW-h per 100 miles as the fuel economy metrics for plug-in cars, but in one option MPGe and annual electricity cost are the two most prominent metrics.[32][33] In November 2010, EPA introduced MPGe as comparison metric on its new sticker for fuel economy for the Nissan Leaf and the Chevrolet Volt.[8][9]
In May 2011, the National Highway Traffic Safety Administration (NHTSA) and EPA issued a joint final rule establishing new requirements for a fuel economy and environment label that is mandatory for all new passenger cars and trucks starting with model year 2013. The ruling includes new labels for alternative fuel and alternative propulsion vehicles available in the US market, such as plug-in hybrids, electric vehicles, flexible-fuel vehicles, hydrogen fuel cell vehicle, and natural gas vehicles.[10][11] The common fuel economy metric adopted to allow the comparison of alternative fuel and advanced technology vehicles with conventional internal combustion engine vehicles is miles per gallon of gasoline equivalent (MPGe). A gallon of gasoline equivalent means the number of kilowatt-hours of electricity, cubic feet of compressed natural gas (CNG), or kilograms of hydrogen that is equal to the energy in a gallon of gasoline.[10]
The new labels also show for the first time an estimate of how much fuel or electricity it takes to drive 100 miles (160 km), introducing to U.S. consumers with fuel consumption per distance traveled, the metric commonly used in many other countries. EPA explained that the objective is to avoid the traditional miles per gallon metric that can be potentially misleading when consumers compare fuel economy improvements, and known as the "MPG illusion."[10]
As mentioned above, confusion and misinterpretation is common in the public between the two types of "fuel efficiency". Fuel economy measures how far a vehicle will go per amount of fuel (units of MPGe). Fuel consumption is the reciprocal of fuel economy, and measures the fuel used to drive a fixed distance (units of Gal/100 miles or kW-h/100 miles).[34] The unit of Gal/100 miles is accurately described as fuel consumption in some EPA brochures, but this unit appears in the fuel economy section of the Monroney label (which doesn't use the term fuel consumption).[35][36]
Description
The miles per gallon gasoline equivalent is based on the energy content of gasoline. The energy obtainable from burning one US gallon of gasoline is 115,000 BTU, 33.70 kWh, or 121.3 MJ.[7]
To convert the mile per gallon rating into other units of distance per unit energy used, the mile per gallon value can be multiplied by one of the following factors to obtain other units:
Conversion to MPGe
MPGe is determined by converting the vehicle consumption per unit distance, as determined through computer modeling or completion of an actual driving cycle, from its native units into a gasoline energy equivalent. Examples of native units include W·h for electric vehicles, kg-H2 for hydrogen vehicles, gallons for biodiesel or liquefied natural gas vehicles, cubic feet for compressed natural gas vehicles, and pounds for propane or Liquefied petroleum gas vehicles. Special cases for specific alternative fuels are discussed below, but a general formula for MPGe is:
![MPGe={\frac {total~miles~driven}{\left[{\frac {total~energy~of~all~fuels~consumed}{energy~of~one~gallon~of~gasoline}}\right]}}={\frac {(total\ miles\ driven)\times (energy\ of\ one\ gallon\ of\ gasoline)}{total~energy~of~all~fuels~consumed}}](../I/m/4d2e871d482869e7af195a10ebd3ce70378adeba.svg)
For EPA, this considers the tank-to-wheel for liquids and wall-to-wheel energy consumption for electricity, i.e. it measures the energy for which the owner usually pays. For EVs the energy cost includes the conversions from AC to charge the battery.[37] The EPA MPGe ratings displayed in window stickers do not account for the energy consumption upstream, which includes the energy or fuel required to generate the electricity or to extract and produce the liquid fuel; the energy losses due to power transmission; or the energy consumed for the transportation of the fuel from the well to the station.[13][38]
Basic values for the energy content of various fuels are given by the defaults used in the Department of Energy GREET (Greenhouse gases, Regulated Emissions, and Energy used in Transportation) model,[39] as follows:
Note: 1 kWh is equivalent to 3,412 BTU
| Fuel | Unit | Btu/Unit | kWh/Unit |
|---|---|---|---|
| gasoline | gallon | 116,090 | 34.02 |
| diesel | gallon | 129,488 | 37.95 |
| biodiesel | gallon | 119,550 | 35.04 |
| ethanol | gallon | 76,330 | 22.37 |
| E85 | gallon | 82,000 | 24.03 |
| CNG | 100 SCF | 98,300 | 28.81 |
| H2-Gas | 100 SCF | 28,900 | 8.47 |
| H2-Liq | gallon | 30,500 | 8.94 |
| LPG | gallon | 84,950 | 24.9 |
| methanol | gallon | 57,250 | 16.78 |
The energy content of a particular fuel can vary somewhat given its specific chemistry and production method. For example, in the new efficiency ratings that have been developed by the United States Environmental Protection Agency (EPA) for battery electric vehicles (BEVs) and plug-in hybrid electric vehicles (PHEVs) – see below – the energy content of a gallon of gasoline is assumed to be 114,989.12 BTU or 33.7 kWh.[7]
Conversion to MPG by cost
The miles per gallon equivalent cost of an alternative fuel vehicle can be calculated by a simple formula to directly compare the MPG operating costs (rather than the energy consumption of MPGe[6]) with traditional vehicles since the cost of resources varies substantially from region to region.[5][4] For reference, the complete equation is:
![{\displaystyle MPG=Mi/G={{\$ \over G}\div {\$ \over unit} \over Capacity(unit)}\times {Capacity(unit) \over [(EnergyQuotent\times 100)\div MPGe]\div 100}}](../I/m/3b1ddb011a7bb3d41e666da2d2bf47ad85030d0f.svg)
Also for those that prefer kWh/100Mi an equivalent is simply:

This equation reduces down to a simple formula that works with only the capacity of the fuel source and it's possible range to compare vehicles. With your local rates for gasoline and your fuel source you can easily compare your alternative fuel vehicle operating cost directly with a Gasoline engine model with the following:

The formula includes the inherent efficiency of the vehicle as the range capability of a specific fuel source capacity directly represents the EPA testing, it then becomes universal regardless of weight, vehicle size, co-efficient of drag, rolling resistance as these directly influence the range possible and are accounted for. Driving style and weather conditions can be accounted for by using the achieved range instead of the advertised range for the calculation.
The formula works by deriving how much alternative fuel can be purchased for the cost of a single gallon of gasoline, and creates a ratio of how this quantity compares to the storage capacity of the vehicle, then multiplies this ratio to the vehicles possible range. The result is number of miles the vehicle travels on alternative fuel for the same cost of a single gallon of gasoline.
The end computation results in MPG unit and is directly comparable to a standard internal combustion engine vehicles fuel costs for its rated MPG.
Examples
The formula with the correct units for a BEV or PHEV in all electric mode is like this.

Using EPA 2018 Fuel Economy Guides assumption's for national average pricing of $2.56/G regular gasoline and $0.13/kWh[40] we can calculate a vehicle that is rated at 84MPGe or 40 kW/100Mi efficiency and has a 16.5 kW EV battery of which 13.5kWh is usable for electric driving with an advertised range of 33 Miles per charge.
Note: Using the battery size instead of the usable charge will provide a conservative value. Using actual charge and actual range driven will provide actual economy.

Calculate how many kWh per Gallon

Now the same vehicle where gasoline with worth $3.20/G and electricity is $0.085/kWh.

Calculate how many kWh per Gallon

Electric and plug-in hybrid electric vehicles
Between 2008 and 2010 several major automakers began commercializing battery electric vehicles (BEVs), which are powered exclusively on electricity, and plug-in hybrid electric vehicles (PHEVs), which use electricity together with a liquid fuel stored in an on-board fuel tank, usually gasoline, but it might be also powered by diesel, ethanol, or flex-fuel engines.
For battery electric vehicles, the U.S. Environmental Protection Agency's formula to calculate the well-to-wheel MPGe is based on energy standards established by the U.S. Department of Energy in 2000:[2][12][13]

where
- is expressed as miles per gallon gasoline equivalent (as shown in the Monroney label)

- energy content per gallon of gasoline = 115,000 Btu/gallon, as set by U.S. DoE and reported by the Alternative Fuel Data Center.[13]

- wall-to-wheel electrical energy consumed per mile (Wh/mi) as measured through EPA's five standard drive cycle tests for electric cars and SAE test procedures[12][37]

- energy unit conversion factor (rounded) = 3.412 Btu/Wh [13]

The formula employed by the EPA for calculating their rated MPGe does not account for any fuel or energy consumed upstream such as the generation and transmission of electrical power, or well-to-wheel life cycle, as EPA's comparison with internal combustion vehicles is made on a tank-to-wheel versus battery-to wheel basis.
The California Air Resources Board uses a different dynamometer testing than EPA, and considers reformulated gasoline sold in that state. For CARB estimates the formula becomes:[12]

The new SAE J1711 standard for measuring the exhaust emissions and fuel economy of hybrid electric vehicles and plug-in hybrids was approved in July 2010. The recommended procedures for PHEVs were revised at Argonne National Laboratory, and EPA's new regulation to define PHEV fuel economy reporting protocol is expected to be based on SAE J1711.[41][42] In November 2010 EPA decided to rate electric mode and gasoline only mode separately, and these are the two figures prominently displayed in the window sticker of the 2011 Chevrolet Volt. In electric mode the Volt's rating is estimated with the same formula as an electric car.[9][12] The overall or composite fuel economy rating combining electricity and gasoline powered are displayed in the Monroney label in a much smaller type, and as part of the comparison of the Volt's fuel economy among all vehicles and within compact cars.[43] EPA has considered several methodologies for rating the overall fuel economy of PHEVs, but as of February 2011 EPA has not announced the final methodology that will be applied for the purposes of estimating the new manufacture's 2012-2016 Corporate Average Fuel Economy (CAFE) credits for plug-in hybrids.[12][44]
Examples
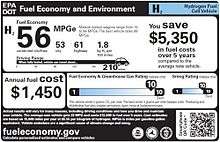
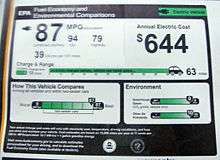
In November 2010 the EPA began including "MPGe" in its new sticker for fuel economy and environmental comparisons. The EPA rated the Nissan Leaf electric car with a combined fuel economy of 99 MPGe,[8] and rated the Chevrolet Volt plug-in hybrid with a combined fuel economy of 93 MPGe in all-electric mode, 37 MPG when operating with gasoline only, and an overall fuel economy rating of 60 mpg-US (3.9 L/100 km) combining power from electricity and gasoline.[9][43][45] For both vehicles EPA calculated the MPGe rating under its five-cycle tests using the formula displayed earlier with a conversion factor of 33.7 kW-h of electricity being the energy equivalent of a gallon of gasoline.[9]
All-electric cars
The following table compares official ratings for fuel economy (miles per gallon gasoline equivalent in the case of plug-in electric vehicles) for series production all-electric passenger vehicles rated by the EPA as of November 2016,[46][47] versus EPA rated most fuel efficient plug-in hybrid with long distance range (Chevrolet Volt – second generation), gasoline-electric hybrid car (Toyota Prius Eco - fourth generation),[48][49][50] and EPA's average new 2016 vehicle, which has a fuel economy of 25 mpg‑US (9.4 L/100 km; 30 mpg‑imp).[46][48]
[] Comparison of fuel efficiency and costs for all the electric cars rated by the EPA for the U.S. market as of November 2016against EPA rated most fuel efficient plug-in hybrid, hybrid electric vehicle and 2016 average gasoline-powered car in the U.S. (Fuel economy and operating costs as displayed in the Monroney label)[46][47][51] | |||||||
|---|---|---|---|---|---|---|---|
| Vehicle | Model year |
EPA rated Combined fuel economy |
EPA rated City fuel economy |
EPA rated Highway fuel economy |
Notes | ||
| Hyundai Ioniq Electric[47][52] | 2017 | 136 mpg-e (25 kW·h/100 mi 15.7 kW⋅h/100 km) | 150 mpg-e (22 kW·h/100 mi 14 kW⋅h/100 km) | 122 mpg-e (28 kW·h/100 mi 17.5 kW⋅h/100 km) | (1) (4) | ||
| BMW i3 (60 A·h)[53][54] | 2014/15/16 | 124 mpg-e (27 kW·h/100 mi 17.2 kW⋅h/100 km) | 137 mpg-e (25 kW·h/100 mi 15.6 kW⋅h/100 km) | 111 mpg-e (30 kW·h/100 mi 19.3 kW⋅h/100 km) | (1) (3) (4) (5) | ||
| Scion iQ EV[55] | 2013 | 121 mpg-e (28 kW·h/100 mi 17.7 kW⋅h/100 km) | 138 mpg-e (24 kW·h/100 mi 15.5 kW⋅h/100 km) | 105 mpg-e (32 kW·h/100 mi 20.4 kW⋅h/100 km) | (1) | ||
| Chevrolet Bolt EV[56] | 2017 | 119 mpg-e (28 kW-h/100 mi 17.7 kW⋅h/100 km) | 128 mpg-e (16.7 kW⋅h/100 km) | 110 mpg-e (19 kW⋅h/100 km) | |||
| Chevrolet Spark EV[57] | 2014/15/16 | 119 mpg-e (28 kW·h/100 mi 18.0 kW⋅h/100 km) | 128 mpg-e (26 kW·h/100 mi 16.7 kW⋅h/100 km) | 109 mpg-e (31 kW·h/100 mi 19.6 kW⋅h/100 km) | (1) | ||
| BMW i3 (94 A·h)[53] | 2017 | 118 mpg-e (29 kW·h/100 mi 18.1 kW⋅h/100 km) | 129 mpg-e (16.6 kW⋅h/100 km) | 106 mpg-e (20.2 kW⋅h/100 km) | (1) | ||
| Honda Fit EV[58] | 2013/14 | 118 mpg-e (29 kW·h/100 mi 18.1 kW⋅h/100 km) | 132 mpg-e (26 kW·h/100 mi 16.2 kW⋅h/100 km) | 105 mpg-e (32 kW·h/100 mi 20.4 kW⋅h/100 km) | (1) | ||
| Fiat 500e[59] | 2013/14/15 | 116 mpg-e (29 kW·h/100 mi 18.4 kW⋅h/100 km) | 122 mpg-e (28 kW·h/100 mi 17.5 kW⋅h/100 km) | 108 mpg-e (31 kW·h/100 mi 19.8 kW⋅h/100 km) | (1) | ||
| Volkswagen e-Golf[60] | 2015/16 | 116 mpg-e (29 kW·h/100 mi 18.4 kW⋅h/100 km) | 126 mpg‑e (27 kW⋅h/100 mi; 17.0 kW⋅h/100 km) | 105 mpg‑e (33 kW⋅h/100 mi; 20.4 kW⋅h/100 km) | (1) | ||
| Nissan Leaf (24 kW-h)[61] | 2013/14/15/16 | 114 mpg-e (30 kW·h/100 mi; 18.7 kW⋅h/100 km) | 126 mpg-e (27 kW·h/100 mi; 17.0 kW⋅h/100 km) | 101 mpg-e (33 kW·h/100 mi; 21 kW⋅h/100 km) | (1) (6) | ||
| Mitsubishi i[62] | 2012/13/14/16 | 112 mpg-e (30 kW·h/100 mi; 19.1 kW⋅h/100 km) | 126 mpg-e (27 kW·h/100 mi; 17.0 kW⋅h/100 km) | 99 mpg-e (34 kW·h/100 mi; 22 kW⋅h/100 km) | (1) | ||
| Nissan Leaf (30 kW-h)[61] | 2016 | 112 mpg-e (30 kW·h/100 mi; 19.1 kW⋅h/100 km) | 124 mpg‑e (28 kW⋅h/100 mi; 17.2 kW⋅h/100 km) | 101 mpg‑e (34 kW⋅h/100 mi; 21 kW⋅h/100 km) | (1) | ||
| Fiat 500e[63] | 2016 | 112 mpg-e (30 kW·h/100 mi; 19.1 kW⋅h/100 km) | 121 mpg-e (28 kW·h/100 mi; 17.7 kW⋅h/100 km) | 103 mpg-e (33 kW·h/100 mi; 21 kW⋅h/100 km) | (1) | ||
| Smart electric drive[64] | 2013/14/15/16 | 107 mpg-e (32 kW·h/100 mi; 20.0 kW⋅h/100 km) | 122 mpg-e (28 kW·h/100 mi; 17.5 kW⋅h/100 km) | 93 mpg-e (36 kW·h/100 mi; 23 kW⋅h/100 km) | (1) (7) | ||
| Kia Soul EV[65] | 2015/16 | 105 mpg-e (32 kW·h/100 mi; 20.4 kW⋅h/100 km) | 120 mpg‑e (29 kW⋅h/100 mi; 18 kW⋅h/100 km) | 92 mpg‑e (37 kW⋅h/100 mi; 23 kW⋅h/100 km) | (1) | ||
| Ford Focus Electric[66] | 2012/13/14/15/16 | 105 mpg-e (32 kW·h/100 mi; 20.4 kW⋅h/100 km) | 110 mpg-e (31 kW·h/100 mi; 19 kW⋅h/100 km) | 99 mpg-e (34 kW·h/100 mi; 22 kW⋅h/100 km) | (1) | ||
| Tesla Model 3 | 2018 | 116 mpg-e (33 kW·h/100 mi; 18.4 kW⋅h/100 km) | 120 mpg-e (33 kW·h/100 mi; 18 kW⋅h/100 km) | 112 mpg-e (33 kW·h/100 mi; 19.1 kW⋅h/100 km) | (1) | ||
| Tesla Model S AWD - 70D[46][67] | 2015/16 | 101 mpg-e (33 kW·h/100 mi; 21 kW⋅h/100 km) | 101 mpg-e (33 kW·h/100 mi; 21 kW⋅h/100 km) | 102 mpg-e (33 kW·h/100 mi; 21 kW⋅h/100 km) | (1) | ||
| Tesla Model S AWD - 85D[46][68] | 2015/16 | 100 mpg-e (34 kW·h/100 mi; 21 kW⋅h/100 km) | 95 mpg-e (35 kW·h/100 mi; 22 kW⋅h/100 km) | 106 mpg‑e (32 kW⋅h/100 mi; 20.2 kWh/100 km) | (1) (8) | ||
| Tesla Model S AWD - 90D[46][67] | 2015/16 | 100 mpg-e (34 kW·h/100 mi; 21 kW⋅h/100 km) | 95 mpg-e (35 kW·h/100 mi; 22 kW⋅h/100 km) | 106 mpg-e (32 kW·h/100 mi; 20.2 kW⋅h/100 km) | (1) | ||
| Tesla Model S (60 kW·h)[46][67] | 2014/15/16 | 95 mpg-e (35 kW·h/100 mi; 22 kW⋅h/100 km) | 94 mpg-e (36 kW·h/100 mi; 23 kW⋅h/100 km) | 97 mpg-e (35 kW·h/100 mi; 22 kW⋅h/100 km) | (1) | ||
| Tesla Model S AWD - P85D[46][68] | 2015/16 | 93 mpg-e (36 kW·h/100 mi; 23 kW⋅h/100 km) | 89 mpg-e (38 kW·h/100 mi; 24 kW⋅h/100 km) | 98 mpg‑e (35 kW⋅h/100 mi; 22 kW⋅h/100 km) | (1) (8) | ||
| Tesla Model S AWD - P90D[46][67] | 2015/16 | 93 mpg-e (36 kW·h/100 mi; 23 kW⋅h/100 km) | 89 mpg-e (38 kW·h/100 mi; 24 kW⋅h/100 km) | 98 mpg-e (35 kW·h/100 mi; 22 kW⋅h/100 km) | (1) | ||
| Tesla Model X AWD – 90D[69] | 2016 | 92 mpg-e (34 kW·h/100 mi; 23 kW⋅h/100 km) | 90 mpg-e (37 kW·h/100 mi; 24 kW⋅h/100 km) | 94 mpg-e (32 kW·h/100 mi; 23 kW⋅h/100 km) | (1) | ||
| Tesla Model X AWD – P90D[69] | 2016 | 89 mpg-e (38 kW·h/100 mi; 24 kW⋅h/100 km) | 89 mpg-e (38 kW·h/100 mi; 24 kW⋅h/100 km) | 90 mpg-e (38 kW·h/100 mi; 24 kW⋅h/100 km) | (1) | ||
| Tesla Model S (85 kW·h)[70] | 2012/13/14/15 | 89 mpg-e (38 kW·h/100 mi; 24 kW⋅h/100 km) | 88 mpg-e (38 kW·h/100 mi; 24 kW⋅h/100 km) | 90 mpg-e (37 kW·h/100 mi; 24 kW⋅h/100 km) | (1) | ||
| Mercedes-Benz B-Class Electric Drive[71] | 2014/15/16 | 84 mpg-e (40 kW·h/100 mi; 25 kW⋅h/100 km) | 85 mpg-e (40 kW·h/100 mi; 25 kW⋅h/100 km) | 83 mpg-e (41 kW·h/100 mi; 26 kW⋅h/100 km) | (1) | ||
| Toyota RAV4 EV[72] | 2012/13/14 | 76 mpg-e (44 kW·h/100 mi; 28 kW⋅h/100 km) | 78 mpg-e (43 kW·h/100 mi; 27 kW⋅h/100 km) | 74 mpg-e (46 kW·h/100 mi; 29 kW⋅h/100 km) | (1) | ||
| BYD e6[46][73] | 2012/13/14/15/16 | 63 mpg-e (54 kW·h/100 mi; 34 kW⋅h/100 km) | 61 mpg-e (55 kW·h/100 mi; 35 kW⋅h/100 km) | 65 mpg-e (52 kW·h/100 mi; 33 kW⋅h/100 km | (1) | ||
| Second gen Chevrolet Volt[46][74][75] Plug-in hybrid (PHEV) Electricity only/ gasoline only | 2016 | 106 mpg-e (31 kW·h/100 mi; 20.2 kW⋅h/100 km) 42 mpg | 113 mpg-e (30 kW⋅h/100 mi; 18.9 kW⋅h/100 km) 43 mpg | 99 mpg-e (35 kW⋅h/100 mi; 22 kW⋅h/100 km) 42 mpg | (1) (2) (9) | ||
| 2016 Toyota Prius Eco (4th gen)[49] Hybrid electric vehicle (HEV) Gasoline-electric hybrid | 2016 | 56 mpg | 58 mpg | 53 mpg | (2) (10) | ||
| Ford Fusion AWD A-S6 2.0L[46][76] Gasoline-powered (Average new vehicle) | 2016 | 25 mpg | 22 mpg | 31 mpg | (2) (11) | ||
| Notes: All estimated fuel costs based on 15,000 miles (24,000 km) annual driving, 45% highway and 55% city (1) Conversion 1 gallon of gasoline=33.7 kW·h. | |||||||
Plug-in hybrids
The following table compares EPA's estimated out-of-pocket fuel costs and fuel economy ratings of serial production plug-in hybrid electric vehicles rated by EPA as of January 2017 expressed in miles per gallon gasoline equivalent (mpg-e),[79][80] versus the most fuel efficient gasoline-electric hybrid car, the 2016 Toyota Prius Eco (fourth generation), rated 56 mpg‑US (4.2 L/100 km; 67 mpg‑imp), and EPA's average new 2016 vehicle, which has a fuel economy of 25 mpg‑US (9.4 L/100 km; 30 mpg‑imp).[80][81][82] The table also shows the fuel efficiency for plug-in hybrids in all-electric mode expressed as KWh/100 mile, the metric used by EPA to rate electric cars before November 2010.[25]
| Comparison of out-of-pocket fuel costs and fuel economy for plug-in hybrid electric cars rated by EPA as of January 2017 with MPGe and conventional MPG(1) (as displayed in the Monroney label and the US DoE fueleconomy.gov website) | |||||||
|---|---|---|---|---|---|---|---|
| Vehicle | Year model | Operating mode (EV range) | EPA rated Combined fuel economy | EPA rated city/highway fuel economy | Fuel cost to drive 25 miles | Annual fuel cost(1) (15,000 mi) | Notes |
| Toyota Prius Prime[79][83] | 2017 | Electricity (25 mi) | 133 mpg-e (25 kWh/100 mi) | - | $0.82 | $550 | The Prius Prime is the most energy-efficient vehicle with a gasoline engine in EV mode.[84] During the first 25 mi might use some gasoline.[83] The 2017 Prime has a combined gasoline/electricity rating of 78 mpg-e (city 83 mpg-e/hwy 73 mpg-e).[85] |
| Gasoline only | 54 mpg | 55 mpg/ 53 mpg | $1.08 | ||||
| BMW i3 REx (60 A·h)[86][87] | 2014 2015 2016 | Electricity only (72 mi) | 117 mpg-e (29 kWh/100 mi) | 97 mpg‑e (35 kW⋅h/100 mi)/ 79 mpg‑e (44 kW⋅h/100 mi) | $0.94 | $650 | The EPA classifies the i3 REx as a series plug-in hybrid while CARB as a range-extended battery-electric vehicle (BEVx). The 2014/16 i3 REx is the most fuel efficient EPA-certified current year vehicle with a gasoline engine with a combined gasoline/electricity rating of 88 mpg-e (city 97 mpg-e/hwy 79 mpg-e).[88][85] |
| Gasoline only (78 mi) | 39 mpg | 41 mpg/ 37 mpg | $1.79 | ||||
| Honda Accord Plug-in Hybrid[89] | 2014 | Electricity and gasoline (13 mi) | 115mpg-e (29 kWh/100 mi) | - | $1.03 | $650 | The 2014 Accord is the most fuel efficient plug-in hybrid in blended EV mode with a rating of 115 mpg-e. The Accord has a rating for combined EV/hybrid operation of 57 mpg-e.[90] |
| Gasoline only | 46 mpg | 47 mpg/ 46 mpg | $1.11 | ||||
| BMW i3 REx (94 A·h)[79][53] | 2017 | Electricity only (97 mi) | 111 mpg-e (30 kWh/100 mi) | - | $0.98 | $650 | The EPA classifies the i3 REx as a series plug-in hybrid while CARB as a range-extended battery-electric vehicle (BEVx). The 2017 i3 REx (94 A·h) has a combined gasoline/electricity rating of 88 mpg-e (city 95 mpg-e/hwy 81 mpg-e), the highest rating among 2017 MY plug-in hybrids.[85] |
| Gasoline only (83 mi) | 35 mpg | 36 mpg/ 33 mpg | $1.99 | ||||
| Chevrolet Volt (2nd gen)[91][92] | 2016 2017 | Electricity only (53 mi) | 106 mpg-e (31 kWh/100 mi) | 113 mpg-e (29 kWh/100 mi)/ 99 mpg-e (34 kWh/100 mi) | $1.01 | $650 | The 2016/17 Volt has a combined gasoline/electricity rating of 77 mpg-e (city 82 mpg-e/hwy 72 mpg-e).[85] Regular gasoline. |
| Gasoline only | 42 mpg | 43 mpg/ 42 mpg | $1.39 | ||||
| Hyundai Sonata PHEV[93] | 2016 | Electricity and gasoline (27 mi) | 99mpg-e (34 kWh/100 mi) | - | $1.19 | $700 | During the first 27 mi uses some gasoline. The actual all-electric range is between 0 to 27 mi.[93] |
| Gasoline only | 40 mpg | - | $1.28 | ||||
| Chevrolet Volt (1st gen)[94][95] | 2013 2014 2015 | Electricity only (38 mi) | 98 mpg-e (35 kWh/100 mi) | - | $1.01 | $650 | The 2013/15 Volt has a combined gasoline/electricity rating of 62 mpg-e (city 63 mpg-e/hwy 61 mpg-e).[88] Premium gasoline. |
| Gasoline only | 37 mpg | 35 mpg/ 40 mpg | $1.21 | ||||
| Ford Fusion Energi[96] | 2017 | Electricity and gasoline (22 mi) | 97 mpg-e (35 kW-h/100 mi) | - | $1.14 | $700 | The actual all-electric range is between 0 to 21 mi.[96] |
| Gasoline only | 42 mpg | - | $1.21 | ||||
| Toyota Prius PHV[97] | 2012 2013 2014 2015 | Electricity and gasoline (11 mi) | 95 mpg-e (29 kWh/100 mi plus 0.2 gallons/100 mi) | - | $1.03 | $600 | After the first 11 miles the car functions like a regular Prius hybrid The 2012/15 Prius has a combined gasoline/electricity rating of 58 mpg-e (city 59 mpg-e/hwy 56 mpg-e).[88] |
| Gasoline only | 50 mpg | 51 mpg/ 49 mpg | $1.02 | ||||
| Chevrolet Volt[98] | 2011 2012 | Electricity only | 94 mpg-e (36 kWh/100 mi) | 95 mpg-e (36 kWh/100 mi)/ 93 mpg-e (37 kWh/100 mi) | $1.17 | $800 | Premium gasoline. |
| Gasoline only | 37 mpg | 35 mpg/ 40 mpg | $1.70 | ||||
| Ford C-Max Energi[99] Ford Fusion Energi[99] | 2013 2014 2015 2016 | Electricity and gasoline (20 mi) | 88 mpg-e (37 kWh/100 mi) | 95 mpg‑e (36 kW⋅h/100 mi)/ 81 mpg‑e (42 kW⋅h/100 mi) | $1.25 | $750 | The Energi did not use any gasoline for the first 20 miles in EPA tests, but depending on the driving style, the car may use both gasoline and electricity during EV mode. The Energi models have a combined EV/hybrid operation rating of 51 mpg-e (city 55 mpg-e/hwy 46 mpg-e).[88] |
| Gasoline only | 38 mpg | 40 mpg/ 36 mpg | $1.34 | ||||
| Audi A3 e-tron ultra[100] | 2016 | Electricity only (17 mi) | 86 mpg-e (38 kWh/100 mi) | - | $1.37 | $900 | During the first 17 mi uses some gasoline. The actual all-electric range is between 0 to 17 mi.[100] |
| Gasoline only | 39 mpg | - | $1.61 | ||||
| Cadillac ELR[101] | 2014 2015 | Electricity only (37 mi) | 82 mpg-e (41 kWh/100 mi) | - | $1.33 | $900 | The 2014/15 ELR has a combined gasoline/electricity rating of 54 mpg-e (city 54 mpg-e/hwy 55 mpg-e).[88] |
| Gasoline only | 33 mpg | 31 mpg/ 35 mpg | $1.90 | ||||
| Chrysler Pacifica Hybrid[102] | 2017 | Electricity only (33 mi) | 84 mpg-e (40 kWh/100 mi) | - | $1.73 | $900 | During the first 33 mi uses some gasoline. The actual all-electric range is between 0 to 33 mi.[102] |
| Gasoline only | 32 mpg | - | $1.83 | ||||
| Audi A3 e-tron[100] | 2016 | Electricity only (16 mi) | 83 mpg-e (40 kWh/100 mi) | - | $1.49 | $950 | During the first 16 mi uses some gasoline. The actual all-electric range is between 0 to 16 mi.[100] |
| Gasoline only | 35 mpg | - | $1.79 | ||||
| BMW i8[86][103] | 2014 2015 2016 | Electricity and gasoline (15 mi) | 76 mpg-e (43 kWh/100 mi) | - | $1.77 | $1,150 | The i8 does not run on 100% electricity as it consumes 0.1 gallons per 100 mi in EV mode (all-electric range = 0 mi) The i8 has a rating for combined EV/hybrid operation of 37 mpg-e.[90] |
| Gasoline only | 28 mpg | 28 mpg/ 29 mpg | $2.24 | ||||
| BMW 330e[104] | 2016 | Electricity and gasoline (14 mi) | 72 mpg-e (47 kWh/100 mi) | - | $1.74 | $1,050 | During the first 14 mi uses some gasoline. The actual all-electric range is between 0 to 14 mi.[104] Premium gasoline. |
| Gasoline only | 31 mpg | - | $2.02 | ||||
| Porsche 918 Spyder[86][105] | 2015 | Electricity only (12 mi) | 67 mpg-e (50 kWh/100 mi) | - | $1.62 | $1,500 | Premium gasoline. |
| Gasoline only | 22 mpg | 20 mpg/ 24 mpg | $2.85 | ||||
| BMW 740e iPerformance[106] | 2017 | Electricity only (14 mi) | 64 mpg-e (52 kWh/100 mi) | - | $2.03 | $1,350 | During the first 14 mi uses some gasoline. The actual all-electric range is between 0 to 14 mi.[106] |
| Gasoline only | 27 mpg | - | $2.48 | ||||
| BMW X5 xDrive40e[107] | 2016 | Electricity only (14 mi) | 56 mpg-e (59 kWh/100 mi) | - | $2.23 | $1,450 | During the first 14 mi uses some gasoline. The actual all-electric range is between 0 to 14 mi.[107] |
| Gasoline only | 24 mpg | - | $2.61 | ||||
| Mercedes-Benz S 500 e[108] | 2015 | Electricity and gasoline (14 mi) | 58 mpg-e (59 kWh/100 mi) | - | $2.13 | $1,350 | During the first 14 mi uses some gasoline. The actual all-electric range is between 0 to 12 mi.[108] Premium gasoline. |
| Gasoline only | 26 mpg | - | $2.41 | ||||
| Fisker Karma[109] | 2012 | Electricity only (33 mi) | 54 mpg-e (62 kWh/100 mi) | - | $2.02 | $1,450 | Premium gasoline. |
| Gasoline only | 20 mpg | 20 mpg/ 21 mpg | $3.14 | ||||
| Volvo XC90 T8[110] | 2016 | Electricity and gasoline (14 mi) | 53 mpg-e (58 kWh/100 mi) | - | $2.19 | $1,400 | During the first 14 mi uses some gasoline. The actual all-electric range is between 0 to 13 mi.[110] Premium gasoline. |
| Gasoline only | 25 mpg | - | $2.51 | ||||
| Porsche Panamera S E-Hybrid[111] | 2016 | Electricity and gasoline (16 mi) | 51 mpg-e (51 kWh/100 mi) | - | $2.15 | $1,350 | The all-electric range is between 0 to 15 mi Premium gasoline. |
| Gasoline only | 25 mpg | 23 mpg/ 29 mpg | $2.51 | ||||
| Porsche Panamera S E-Hybrid[111] | 2014 2015 | Electricity and gasoline (16 mi) | 50 mpg-e (52 kWh/100 mi) | - | $2.18 | $1,400 | The all-electric range is between 0 to 15 mi The S E-Hybrid has a rating for combined EV/hybrid operation of 31 mpg-e.[90] |
| Gasoline only | 25 mpg | 23 mpg/ 29 mpg | $2.51 | ||||
| Porsche Cayenne S E-Hybrid[86][112] | 2015 2016 | Electricity and gasoline (14 mi) | 47 mpg-e (69 kWh/100 mi) | - | $2.24 | $1,550 | Premium gasoline. |
| Gasoline only | 22 mpg | 21 mpg/ 24 mpg | $2.85 | ||||
| McLaren P1[86][113] | 2014 2015 | Electricity and gasoline (19 mi) | 18 mpg-e (25 kWh/100 mi) | - | $3.79 | $2,200 | The P1 does not run on 100% electricity as it consumes 4.8 gallons per 100 mi in EV mode (all-electric range = 0 mi)[113] The P1 has a rating for combined EV/hybrid operation of 17 mpg-e.[90] |
| Gasoline only | 17 mpg | 16 mpg/ 20 mpg | $3.69 | ||||
| 2016 Toyota Prius Eco (4th gen)[82] | 2016 | Gasoline-electric hybrid | 56 mpg | 58 mpg/ 53 mpg | $0.91 | $550 | Most fuel efficient hybrid electric car.[80] |
| Ford Fusion AWD 2.0L[80][76] (Average new vehicle) | 2016 | Gasoline only | 25 mpg | 22 mpg/ 31 mpg | $2.04 | $1,200 | Other 2016 MY cars achieving 25 mpg combined city/hwy include the Honda Accord 3.5L, Toyota Camry 3.5L and Toyota RAV4 2.5L.[80][76] |
| Notes: (1) Based on 45% highway and 55% city driving. Electricity cost of US$0.13/kWh, premium gasoline price of US$2.51 per gallon (used by the 2015 Volt, i3 REx, ELR, i8, Mercedes S500e, Karma and all Porsche models), and regular gasoline price of US$2.04 per gallon (as of 18 December 2015). Conversion 1 gallon of gasoline=33.7 kWh. | |||||||
Fuel cell vehicles
The following table compares EPA's fuel economy expressed in miles per gallon gasoline equivalent (MPGe) for the four hydrogen fuel cell vehicles rated by the EPA as of November 2016, and available only in California.[114]
| Comparison of fuel economy expressed in MPGe for hydrogen fuel cell vehicles available for leasing in California and rated by the U.S. Environmental Protection Agency as of November 2016[114] | |||||||
|---|---|---|---|---|---|---|---|
| Vehicle | Model year | Combined fuel economy |
City fuel economy |
Highway fuel economy |
Range | Annual fuel cost | |
| Honda FCX Clarity | 2014 | 59 mpg-e | 58 mpg-e | 60 mpg-e | 231 mi (372 km) | NA | |
| Hyundai Tucson Fuel Cell | 2016-17 | 49 mpg-e | 48 mpg-e | 50 mpg-e | 265 mi (426 km) | US$1,700 | |
| Toyota Mirai | 2016-17 | 66 mpg-e | 66 mpg-e | 66 mpg-e | 312 mi (502 km) | US$1,250 | |
| Honda Clarity Fuel Cell | 2017 | 67 mpg-e | 68 mpg-e | 66 mpg-e | 366 mi (589 km) | US$1,250 | |
| Notes: One kg of hydrogen is roughly equivalent to one U.S. gallon of gasoline. | |||||||
Conversion using GGE
The same method can be applied to any other alternative fuel vehicle when that vehicle's energy consumption is known. Generally the energy consumption of the vehicle is expressed in units other than W·h/mile, or Btu/mile so additional arithmetic is required to convert to a gasoline gallon equivalent (GGE), using 33.7 kWh / gallon = 114989.17 btu / gallon.[7]
Hydrogen example with GGE
The 2008 Honda FCX Clarity is advertised to have a vehicle consumption of 72 mi/kg-H
2.[115] Hydrogen at atmospheric pressure has an energy density of 120 MJ/kg (113,738 BTU/kg),[116] by converting this energy density to a GGE, it is found that 1.011 kg of hydrogen is needed to meet the equivalent energy of one gallon of gasoline. This conversion factor can now be used to calculate the MPGe for this vehicle.
- ,


Life cycle assessment
Pump/Well-to-wheel
EPA's miles per gallon equivalent metric shown in the window sticker does not measure a vehicle's full cycle energy efficiency or well-to-wheel life cycle. Rather, the EPA presents MPGe in the same manner as MPG for conventional internal combustion engine vehicles as displayed in the Monroney sticker, and in both cases the rating only considers the pump-to-wheel or wall-to-wheel energy consumption, i.e. it measures the energy for which the owner usually pays. For EVs the energy cost includes the conversions from AC from the wall used to charge the battery[37] The EPA ratings displayed in window stickers do not account for the energy consumption upstream, which includes the energy or fuel required to generate the electricity or to extract and produce the liquid fuel; the energy losses due to power transmission; or the energy consumed for the transportation of the fuel from the well to the station.[13][38]
Petroleum-equivalency factor (PEF) — a CAFE metric
In 2000 the United States Department of Energy (DOE) established the methodology for calculating the petroleum-equivalent fuel economy of electric vehicles based on the well-to-wheel (WTW) gasoline-equivalent energy content of electricity (Eg). The methodology considers the upstream efficiency of the processes involved in the two fuel cycles, and considers the national average electricity generation and transmission efficiencies because a battery electric vehicle burns its fuel (mainly fossil fuels) off-board at the power generation plant.[13] This methodology is used by carmakers to estimate credits into their overall Corporate Average Fuel Economy (CAFE) for manufacturing electric drive vehicles.[12]
The equations for determining the petroleum equivalent fuel economy of electric vehicles are the following:[13]
- PEF = Eg * 1/0.15 * AF * DPF
- where:
- PEF = Petroleum-equivalent fuel economy
- Eg = Gasoline-equivalent energy content of electricity factor
- 1/0.15 = "Fuel content" factor or incentive factor. DoE selected this value to keep consistency with existing regulatory and statutory procedures, and to provide a similar treatment to manufacturers of all types of alternative fuel vehicles
- AF = Petroleum-fueled accessory factor
- DPF = Driving pattern factor
- where:
The gasoline-equivalent energy content of electricity factor, abbreviated as Eg, is defined as:
- Eg = gasoline-equivalent energy content of electricity = (Tg * Tt * C) / Tp
- where:
- Tg = U.S. average fossil-fuel electricity generation efficiency = 0.328
- Tt = U.S. average electricity transmission efficiency = 0.924
- Tp = Petroleum refining and distribution efficiency = 0.830
- C = Watt-hours of energy per gallon of gasoline conversion factor = 33,705 Wh/gal
- Eg = (0.328 * 0.924 * 33705)/0.830 = 12,307 Wh/gal
- where:
- PEF = Eg * 1/0.15 * AF * DPF = 12,307 Wh/gal/0.15 * AF * DPF
- PEF = 82,049 Wh/gal * AF * DPF
The petroleum-fueled accessory factor, AF, is equal to 1 if the electric drive vehicle does not have petroleum-powered accessories installed, and 0.90 if it does.
The driving pattern factor, DPF, is equal to 1, as DoE considered that electric vehicles eligible for inclusion in CAFE will offer capabilities, perhaps excepting driving range, similar to those of conventional vehicles.
In the example provided by the US DoE in its final rule, an electric car with an energy consumption of 265 Watt-hour per mile in urban driving, and 220 Watt-hour per mile in highway driving, resulted in a petroleum-equivalent fuel economy of 335.24 miles per gallon, based on a driving schedule factor of 55 percent urban, and 45 percent highway, and using a petroleum equivalency factor of 82,049 Watt-hours per gallon.[13]
See also
References
- ↑ EPA,OAR,OTAQ, US. "Electric Vehicles - Learn More About the New Label | US EPA". US EPA. Retrieved 2018-01-31.
- 1 2 Paul Seredynski (2010-12-21). "Decoding Electric Car MPG: With Kilowatt-Hours, Small Is Beautiful". Edmunds.com. Retrieved 2011-02-17.
- 1 2 3 4 "Fuel Economy Label". U.S. Environmental Protection Agency. 2011-02-14. Retrieved 2011-02-17.
- 1 2 "EIA - Electricity Data". www.eia.gov. Retrieved 2018-01-30.
- 1 2 "Natural Gas Residential Price". www.eia.gov. Retrieved 2018-01-30.
- 1 2 "The True Cost of Powering an Electric Car". Edmunds. Retrieved 2018-01-30.
- 1 2 3 4 U.S. Environmental Protection Agency (EPA) (May 2011). "New Fuel Economy and Environment Labels for a New Generation of Vehicles". EPA. Retrieved 2016-12-12.
- 1 2 3 Nick Bunkley (2010-11-22). "Nissan Says Its Electric Leaf Gets Equivalent of 99 M.P.G." The New York Times. Retrieved 2011-02-17.
- 1 2 3 4 5 Fred Meier (2010-11-24). "Volt is rated 93 mpg on electricity alone, 37 mpg on gas generator". USA Today. Retrieved 2011-02-17.
- 1 2 3 4 EPA (May 2011). "Fact Sheet: New Fuel Economy and Environment Labels for a New Generation of Vehicles" (PDF). U.S. Environmental Protection Agency. Retrieved 2011-05-25. EPA-420-F-11-017
- 1 2 "EPA, DOT unveil the next generation of fuel economy labels". Green Car Congress. 2011-05-25. Retrieved 2011-05-25.
- 1 2 3 4 5 6 7 Paul Weissler (2009-07-06). "Many factors figure in fuel-economy calculation for electric vehicles". Automotive Engineering International Online (SAE International Magazine). Retrieved 2011-02-23.
- 1 2 3 4 5 6 7 8 9 10 11 "Electric and Hybrid Vehicle Research, Development, and Demonstration Program; Petroleum-Equivalent Fuel Economy Calculation; Final Rule" (PDF). 2000-06-12. Retrieved 2011-02-20.
- ↑ "Report to Congress on Effects of the Alternative Motor Fuels Act CAFE Incentives Policy". National Highway Traffic Safety Administration. Retrieved 2011-02-22.
- 1 2 3 4 5 "The Corporate Average Fuel Economy Program (CAFE) - Background: AMFA CAFE Credits". National Highway Traffic Safety Administration. Retrieved 2011-02-22.
- ↑ "Handbook 44 Appendix D -Definitions" (PDF). National Institute of Standards and Technology. 2007. Archived from the original (PDF) on 2009-01-09. Retrieved 2009-01-02.
- ↑ Electric Transportation Applications (1996). "Test Reports for Vehicles by Manufacturer and Model: General Motors EV1" (PDF). Idaho National Laboratory, US DoE. Archived from the original (PDF) on 2011-07-19. Retrieved 2011-02-21.
- ↑ Electric Transportation Applications (1999). "Test Reports for Vehicles by Manufacturer and Model: 1999 General Motors EV1 w/NiMH" (PDF). Idaho National Laboratory, US DoE. Archived from the original (PDF) on 2011-07-19. Retrieved 2011-02-21.
- ↑ Electric Transportation Applications (1996). "Test Reports for Vehicles by Manufacturer and Model: Toyota RAV4 EV" (PDF). Idaho National Laboratory, US DoE. Archived from the original (PDF) on 2011-07-19. Retrieved 2011-02-21. Energy use averaged 2.5 miles per AC kWh (0.4 AC kWh per mile)
- ↑ Electric Transportation Applications (March 2000). "Field Operations Program Toyota RAV4 (NiMH) - Accelerated Reliability Testing - Final Report" (PDF). Idaho National Laboratory, US DoE. Archived from the original (PDF) on 2011-07-19. Retrieved 2011-02-21. Energy use averaged 2.5 miles per AC kWh (0.4 AC kWh per mile)
- ↑ Electric Transportation Applications (1997). "Test Reports for Vehicles by Manufacturer and Model: 1998 Ford Ranger EV" (PDF). Idaho National Laboratory, US DoE. Archived from the original (PDF) on 2011-07-19. Retrieved 2011-02-21.
- ↑ Electric Transportation Applications (1997). "Test Reports for Vehicles by Manufacturer and Model: 1997 Chevrolet S-10 Electric" (PDF). Idaho National Laboratory, US DoE. Archived from the original (PDF) on 2011-07-19. Retrieved 2011-02-21.
- ↑ Sperling, Daniel and Deborah Gordon (2009). Two billion cars: driving toward sustainability. Oxford University Press, New York. pp. 22–26. ISBN 978-0-19-537664-7.
- ↑ Sherry Boschert (2006). Plug-in Hybrids: The Cars that will Recharge America. New Society Publishers, Gabriola Island, Canada. pp. 15–28. ISBN 978-0-86571-571-4.
- 1 2 3 4 "Why are the VOLT and LEAF EVs measured in Miles Per Gallon". Electric Vehicle News. 2009-08-15. Retrieved 2011-02-21.
- ↑ "Press Release: Automotive X Prize Announces Draft Guidelines for Competition to Inspire Super-Efficient Vehicles". X Prize Foundation. Retrieved 2010-12-01.
- ↑ "Press Release: Consumer Reports to Adopt MPGe Measure for Fuel Economy". X Prize Foundation. Retrieved 2010-12-07.
- 1 2 Office of Transportation and Air Quality, EPA, and National Highway Traffic Safety Administration, Us DoT (September 2010). "Environmental Protection Agency Fuel Economy Label - Final Report" (PDF). U.S. Environmental Protection Agency. Retrieved 2011-02-20.
- 1 2 Brad Berman (2009-07-29). "Confusion Over MPG Ratings for Electric Cars". HybridCars.com. Retrieved 2014-03-15.
- ↑ Don Sherman (2008-11-13). "Cranking the Volt to 100 M.P.G." The New York Times. Retrieved 2014-03-15.
- ↑ "2009 Tesla Roadster window sticker". The New York Times. 2008-11-13. Retrieved 2014-03-15.
- ↑ "EPA and NHTSA Propose Changes to the Motor Vehicle Fuel Economy Label" (PDF). U.S. Environmental Protection Agency. August 2010. Retrieved 2011-02-20.
- ↑ Jim Motavalli (2010-08-30). "E.P.A. Develops Grading System for New Car Stickers". The New York Times. Retrieved 2011-02-20.
- ↑ "Assessment of Fuel Economy Technologies for Light-duty Vehicles". The National Academies Press. 2011. p. 12. ISBN 978-0-309-15607-3. Retrieved 2016-09-18.
- ↑ "Understanding the New Fuel Economy and Environment Labels" (PDF). U.S. Environmental Protection Agency. Retrieved 2016-09-18.
- ↑ "FE and Environment Label - Brochure" (PDF). U.S. Environmental Protection Agency. Retrieved 2016-09-18.
- 1 2 3 Michael Duoba; R. Carlson; J. Wu. "TEST PROCEDURES AND BENCHMARKING Blended-Type and EV-Capable Plug-In Hybrid Electric Vehicles" (PDF). Argonne National Laboratory. Retrieved 2012-11-22.
- 1 2 MIT Electric Vehicle Team (March 2008). "Fuel Economy Numbers for Electric Vehicles" (PDF). Massachusetts Institute of Technology. Retrieved 2011-02-24.
- ↑ GREET model retrieved 2011 01 20
- ↑ https://www.fueleconomy.gov/feg/pdfs/guides/FEG2018.pdf
- ↑ "SAE Approves Method for Rating Plug-In Hybrid MPG and Emissions". EV World. 2010-07-01. Retrieved 2011-02-26.
- ↑ "Recommended Practice for Measuring the Exhaust Emissions and Fuel Economy of Hybrid-Electric Vehicles, Including Plug-in Hybrid Vehicles". SAE International. 2010-06-08. Retrieved 2011-02-26.
- 1 2 Nick Bunkley (2010-11-24). "3 Numbers to Rate Volt's Fuel Economy". The New York Times. Retrieved 2011-02-24.
- ↑ Nick Bunkley & Bill Vlasic (2010-10-14). "Plug-In Cars Pose Riddle for E.P.A." The New York Times. Retrieved 2011-02-24.
- ↑ "Volt receives EPA ratings and label: 93 mpg-e all-electric, 37 mpg gas-only, 60 mpg-e combined". Green Car Congress. 2010-11-24. Retrieved 2010-11-24.
- 1 2 3 4 5 6 7 8 9 10 11 12 13 14 United States Environmental Protection Agency and U.S. Department of Energy (2015-12-18). "Model Year 2016 Fuel Economy Guide - Electric vehicles & Plug-in Hybrid Electric Vehicles" (PDF). fueleconomy.gov. Retrieved 2015-12-18. See pp. 27–28 for all-electric vehicles and pp. 30–31 for plug-in hybrid electric vehicles. The average 2016 vehicle gets 25 mpg
- 1 2 3 United States Environmental Protection Agency and U.S. Department of Energy (2016-11-16). "Model Year 2017 Fuel Economy Guide - Electric vehicles & Plug-in Hybrid Electric Vehicles" (PDF). fueleconomy.gov. Retrieved 2016-11-19. pp. 32–36.
- 1 2 3 4 5 U. S. Environmental Protection Agency and U.S. Department of Energy (2015-12-04). "Fueleconomy.gov's Top Fuel Sippers (EPA Ratings, All Years)". fueleconomy.gov. Retrieved 2015-12-06. Excludes all-electric vehicles. Click on the tab "Top Fuel Sippers (EPA Ratings, All Years)" - The 2016 Volt has a combined fuel economy of 77 mpg-e. The BMW i3 REx has a combined fuel economy of 88 mpg-e, and ranks as the most efficient EPA-certified current year vehicle with a gasoline engine.
- 1 2 U. S. Environmental Protection Agency and U.S. Department of Energy (2015-12-18). "Compare Side-by-Side - 2015 Toyota Prius, 2016 Toyota Prius and 2016 Toyota Prius Eco". Fueleconomy.gov. Retrieved 2015-12-18. The average 2016 vehicle gets 25 mpg.
- ↑ U. S. Environmental Protection Agency and U.S. Department of Energy (2015-08-14). "2016 Best and Worst Fuel Economy Vehicles - (excluding electric vehicles)". Fueleconomy.gov. Retrieved 2015-08-17. See the tab "Cars excl. EVs" – The Prius c is the most fuel efficient in the compact class and the conventional Prius is the most fuel efficient in the midsize class, and both rank ahead of the most fuel efficient in any other clars.
- ↑ United States Environmental Protection Agency and U.S. Department of Energy (2015-08-12). "Model Year 2015 Fuel Economy Guide - Electric vehicles & Plug-in Hybrid Electric Vehicles" (PDF). fueleconomy.gov. Retrieved 2015-08-17. pp. 31–34.
- ↑ United States Environmental Protection Agency and U.S. Department of Energy (2016-11-18). "Compare Side-by-Side: 2017 Hyundai Ioniq Electric". fueleconomy.gov. Retrieved 2016-11-19.
- 1 2 3 United States Environmental Protection Agency and U.S. Department of Energy (2016-09-29). "Compare Side-by-Side: 2015 BMW i3 REX, 2016 BMW i3 REX, 2017 BMW i3 REX (94 Amp-hour battery), and 2017 BMW i3 BEV (94 Amp-hour battery)". fueleconomy.gov. Retrieved 2016-09-30.
- ↑ United States Environmental Protection Agency and U.S. Department of Energy (2015-12-04). "Compare Side-by-Side: 2014 BMW i3 BEV". fueleconomy.gov. Retrieved 2015-12-06.
- ↑ U. S. Environmental Protection Agency and U.S. Department of Energy (2015-12-04). "2013 Scion iQ EV". Fueleconomy.gov. Retrieved 2015-12-06.
- ↑ Energy Efficiency & Renewable Energy, U.S. Department of Energy and U. S. Environmental Protection Agency and (2016-09-20). "Compare Side-by-Syde - 2017 Chevrolet Bolt". fueleconomy.gov. Retrieved 2016-09-20.
- ↑ U. S. Environmental Protection Agency and U.S. Department of Energy (2015-12-04). "2014 Chvevrolet Spark EV". Fueleconomy.gov. Retrieved 2015-12-06.
- ↑ U. S. Environmental Protection Agency and U.S. Department of Energy (2015-12-04). "2013 Honda Fit EV". Fueleconomy.gov. Retrieved 2015-12-06.
- ↑ U. S. Environmental Protection Agency and U.S. Department of Energy (2015-12-04). "2013 Fiat 500e". Fueleconomy.gov. Retrieved 2015-12-06.
- ↑ U.S. Environmental Protection Agency and U.S. Department of Energy (2015-12-04). "2015 Volkswagen e-Golf". Fueleconomy.gov. Retrieved 2015-12-06.
- 1 2 U.S. Environmental Protection Agency and U.S. Department of Energy (2015-12-04). "Compare side by side: 2013 Nissan Leaf/2014 Nissan Leaf/2015 Nissan Leaf/2016 Nissan Leaf (24 kW-hr battery pack)/2016 Nissan Leaf (30 kW-hr battery pack)". Fueleconomy.gov. Retrieved 2015-12-06.
- ↑ U.S. Environmental Protection Agency and U.S. Department of Energy (2015-12-04). "2011–12 Electric Vehicles- 2012 Mitsubishi i-MiEV". Fueleconomy.gov. Retrieved 2015-12-06.
- ↑ U. S. Environmental Protection Agency and U.S. Department of Energy (2015-12-04). "2016 Fiat 500e". Fueleconomy.gov. Retrieved 2015-12-06.
- ↑ U. S. Environmental Protection Agency and U.S. Department of Energy (2015-12-04). "2013 smart fortwo electric drive coupe". Fueleconomy.gov. Retrieved 2015-12-06.
- ↑ U. S. Environmental Protection Agency and U.S. Department of Energy (2015-12-04). "2015 Kia Soul Electric". Fueleconomy.gov. Retrieved 2015-12-06.
- ↑ U. S. Environmental Protection Agency and U.S. Department of Energy (2015-12-04). "2012 Ford Focus BEV". Fueleconomy.gov. Retrieved 2015-12-06.
- 1 2 3 4 U. S. Environmental Protection Agency and U.S. Department of Energy (2015-12-04). "Compare Side-by-Side - 2015 Tesla Model S 60 kW-hr/AWD - 70D/AWD - 90D/AWD - P90D". Fueleconomy.gov. Retrieved 2015-12-06.
- 1 2 U. S. Environmental Protection Agency and U.S. Department of Energy (2015-12-04). "2015 Tesla Model S (85 kW-hr battery pack); 2014 Tesla Model S AWD (85 kW-hr battery pack); 2015 Tesla Model S AWD - 85D; and 2015 Tesla Model S AWD - P85D". Fueleconomy.gov. Retrieved 2015-12-06.
- 1 2 U. S. Environmental Protection Agency and U.S. Department of Energy (2015-12-04). "2016 Tesla Model X AWD - 90D and P90D". Retrieved 2015-12-06.
- ↑ U. S. Environmental Protection Agency and U.S. Department of Energy (2015-12-04). "2012 Tesla Model S". Fueleconomy.gov. Retrieved 2015-12-06.
- ↑ U.S. Environmental Protection Agency and U.S. Department of Energy (2015-12-04). "2014/2015/2016 Mercedes-Benz B-Class Electric Drive". Fueleconomy.gov. Retrieved 2015-12-06.
- ↑ U.S. Environmental Protection Agency and U.S. Department of Energy (2015-12-04). "2012/2013/2014 Toyota RAV4 EV". Fueleconomy.gov. Retrieved 2015-12-06.
- ↑ U.S. Environmental Protection Agency and U.S. Department of Energy (2015-12-04). "Compare Side-by-Side: 2012/13/14/15 BYD e6". Fueleconomy.gov. Retrieved 2015-12-06.
- ↑ U.S. Environmental Protection Agency and U.S. Department of Energy (2015-12-04). "Compare Side-by-Side - 2016/2015 Chevrolet Volt". Fueleconomy.gov. Retrieved 2015-12-06.
- ↑ Eric Loveday (2015-09-01). "Detailed Look At 2016 Chevrolet Volt EPA Ratings". InsideEVs.com. Retrieved 2015-09-02.
- 1 2 3 4 United States Environmental Protection Agency and U.S. Department of Energy (2015-12-04). "Compare Side-by-Side: 2016 Ford Fusion AWD, 2016 Honda Accord, 2016 Toyota Camry, and 2016 Toyota RAV4 AWD". fueleconomy.gov. Retrieved 2015-12-06.
- 1 2 U.S. Environmental Protection Agency and U.S. Department of Energy (2016-11-18). "Most Efficient EPA Certified Vehicles". fueleconomy.gov. Retrieved 2016-11-19. Current Model Year excludes all-electric vehicles.
- ↑ United States Environmental Protection Agency and U.S. Department of Energy (2014-07-04). "Compare Side-by-Side: 2014 BMW i3 BEV & 2014 BMW i3 REx". fueleconomy.gov. Retrieved 2014-07-26.
- 1 2 3 United States Environmental Protection Agency and U.S. Department of Energy (2017-01-11). "Model Year 2017 Fuel Economy Guide - Electric vehicles & Plug-in Hybrid Electric Vehicles" (PDF). fueleconomy.gov. Retrieved 2017-01-16. See pp. 34 - 38 for all-electric vehicles and plug-in hybrid electric vehicles.
- 1 2 3 4 5 United States Environmental Protection Agency and U.S. Department of Energy (2015-12-18). "Model Year 2016 Fuel Economy Guide - Electric vehicles & Plug-in Hybrid Electric Vehicles" (PDF). fueleconomy.gov. Retrieved 2015-12-18. See pp. 27-28 for all-electric vehicles and pp. 30-31 for plug-in hybrid electric vehicles. The average 2016 vehicle gets 25 mpg
- ↑ U. S. Environmental Protection Agency and U.S. Department of Energy (2015-08-14). "2015 Best and Worst Fuel Economy Vehicles - (excluding electric vehicles)". Fueleconomy.gov. Retrieved 2015-08-17. See the tab "Cars excl. EVs" - The Prius c is the most fuel efficient in the compact class and the conventional Prius is the most fuel efficient in the midsize class, and both rank ahead of the most fuel efficient in any other clars.
- 1 2 U. S. Environmental Protection Agency and U.S. Department of Energy (2015-12-18). "Compare Side-by-Side - 2015 Toyota Prius, 2016 Toyota Prius and 2016 Toyota Prius Eco". Fueleconomy.gov. Retrieved 2015-12-18. The average 2016 vehicle gets 25 mpg.
- 1 2 United States Environmental Protection Agency and U.S. Department of Energy (2017-01-16). "Compare Side-by-Side - 2017 Prius Prime". fueleconomy.gov. Retrieved 2017-01-16.
- ↑ U. S. Environmental Protection Agency and U.S. Department of Energy (2017-01-16). "Compare Side-by-Side - 2017 Toyota Prius Prime - 2016 BMW i3 REX - 2017 BMW i3 REX (94 Amp-hour battery) - 2017 Chevrolet Volt". fueleconomy.gov. Retrieved 2017-01-16. The Prius Prime is the most energy-efficient vehicle with a gasoline engine in EV mode (133 MPG-e).
- 1 2 3 4 U. S. Environmental Protection Agency and U.S. Department of Energy (2017-01-16). "Top Fuel Sippers (EPA Ratings, 2017 Model Year) Excludes EVs". fueleconomy.gov. Retrieved 2017-01-16. Current Model Year excludes all-electric vehicles. The 2017 BMW i3 REX (94 Amp-hour battery) has a combined gas/electricity fuel economy rating of 88 mpg-e (95/81 city/hwy), the 2017 Prius Prime has a combined gas/electricity rating of 78 mpg-e (83/73 city/hwy), and the 2017 Chevrolet Volt has a combined gas/electricity rating of 77 mpg-e (82/72 city/hwy).
- 1 2 3 4 5 United States Environmental Protection Agency and U.S. Department of Energy (2015-08-12). "Model Year 2015 Fuel Economy Guide - Electric vehicles & Plug-in Hybrid Electric Vehicles" (PDF). fueleconomy.gov. Retrieved 2015-08-17. pp. 31-34
- ↑ United States Environmental Protection Agency and U.S. Department of Energy (2016-09-16). "Compare Side-by-Side - 2014/2015/2016 BMW i3 REx". fueleconomy.gov. Retrieved 2016-09-19.
- 1 2 3 4 5 U. S. Environmental Protection Agency and U.S. Department of Energy (2015-12-04). "Fueleconomy.gov's Top Fuel Sippers (EPA Ratings, All Years)". fueleconomy.gov. Retrieved 2015-12-05. Excludes all-electric vehicles. Click on the tab "Top Fuel Sippers (EPA Ratings, All Years)" - The 2013-2014 Chevrolet Volt has a combined fuel economy of 62 mpg-e, while 2016 Volt has a combined fuel economy of 77 mpg-e. The BMW i3 REx has a combined fuel economy of 88 mpg-e
- ↑ U. S. Environmental Protection Agency and U.S. Department of Energy (2015-12-18). "Compare Side-by-Side - 2014 Honda Accord Plug-in Hybrid". Fueleconomy.gov. Retrieved 2015-12-18.
- 1 2 3 4 U. S. Environmental Protection Agency (October 2014). "Light-Duty Automotive Technology, Carbon Dioxide Emissions, and Fuel Economy Trends: 1975 Through 2014" (PDF). EPA. Retrieved 2014-10-12. See table 7.3 - Overall fuel economy (mpg-e), pp. 100.
- ↑ U.S. Environmental Protection Agency and U.S. Department of Energy (2016-03-18). "Compare Side-by-Side - 2017/2016 Chevrolet Volt". Fueleconomy.gov. Retrieved 2016-03-20.
- ↑ Eric Loveday (2015-09-01). "Detailed Look At 2016 Chevrolet Volt EPA Ratings". InsideEVs.com. Retrieved 2015-09-02.
- 1 2 U. S. Environmental Protection Agency and U.S. Department of Energy (2015-12-18). "Compare Side-by-Side - 2016 Hyundai Sonata Plug-in Hybrid". Fueleconomy.gov. Retrieved 2015-12-18.
- ↑ U.S. Environmental Protection Agency and U.S. Department of Energy (2015-12-18). "Compare Side-by-Side - 2015/2016 Chevrolet Volt". Fueleconomy.gov. Retrieved 2015-12-18.
- ↑ U.S. Environmental Protection Agency and U.S. Department of Energy (2015-12-18). "Compare Side-by-Side - 2013/2014/2015 Chevrolet Volt". Fueleconomy.gov. Retrieved 2015-12-18.
- 1 2 U.S. Environmental Protection Agency and U.S. Department of Energy (2016-05-27). "Compare Side-by-Side - 2016/2017 Ford Fusion Energi Plug-in Hybrid". Fueleconomy.gov. Retrieved 2016-05-27.
- ↑ U. S. Environmental Protection Agency and U.S. Department of Energy (2015-12-18). "Compare Side-by-Side - 2012/2013/2014/2015 Toyota Prius Plug-in Hybrid". Fueleconomy.gov. Retrieved 2015-12-18.
- ↑ U. S. Environmental Protection Agency and U.S. Department of Energy (2015-12-18). "Compare Side-by-Side - 2011/2012 Chevrolet Volt". Fueleconomy.gov. Retrieved 2014-12-18.
- 1 2 U. S. Environmental Protection Agency and U.S. Department of Energy (2015-08-14). "Compare Side-by-Side - 2013/2015 Ford C-Max Plug-in Hybrid and 2013/2015 Ford Fusion Plug-in Hybrid". Fueleconomy.gov. Retrieved 2015-08-16.
- 1 2 3 4 U.S. Environmental Protection Agency and U.S. Department of Energy (2015-11-27). "Compare side by side: 2016 Audi A3 e-tron ultra and 2016 Audi A3 e-tron". Fueleconomy.gov. Retrieved 2015-11-30.
- ↑ U.S. Environmental Protection Agency and U.S. Department of Energy (2015-08-14). "Compare Side-by-Side - 2014/2015 Cadillac ELR". Fueleconomy.gov. Retrieved 2015-08-16.
- 1 2 U.S. Environmental Protection Agency and U.S. Department of Energy (2016-12-06). "Compare Side-by-Side - 2017 Chrysler Pacifica Plug-in Hybrid". Fueleconomy.gov. Retrieved 2016-12-07.
- ↑ U.S. Environmental Protection Agency and U.S. Department of Energy (2016-03-18). "Compare Side-by-Side - 2014/2015/2016 BMW i8". Fueleconomy.gov. Retrieved 2016-03-20.
- 1 2 U.S. Environmental Protection Agency and U.S. Department of Energy (2016-03-18). "2016 BMW 330e". Fueleconomy.gov. Retrieved 2016-03-20.
- ↑ U.S. Environmental Protection Agency and U.S. Department of Energy (2015-12-18). "Compare Side-by-Side - 2015 Porsche 918 Spyder". Fueleconomy.gov. Retrieved 2015-12-19.
- 1 2 Energy Efficiency & Renewable Energy, U.S. Department of Energy and U. S. Environmental Protection Agency and (2016-09-19). "Compare Side-by-Syde - 2017 BMW 740e xDrive". fueleconomy.gov. Retrieved 2016-09-19.
- 1 2 U.S. Environmental Protection Agency and U.S. Department of Energy (2015-12-18). "2016 BMW X5 xDrive40e". Fueleconomy.gov. Retrieved 2015-12-19.
- 1 2 U.S. Environmental Protection Agency and U.S. Department of Energy (2015-12-18). "2015 Mercedes-Benz S550e". Fueleconomy.gov. Retrieved 2015-12-19.
- ↑ U. S. Environmental Protection Agency and U.S. Department of Energy (2015-12-18). "Compare Side-by-Side - 2012 Fisker Karma". Fueleconomy.gov. Retrieved 2015-12-19.
- 1 2 U.S. Environmental Protection Agency and U.S. Department of Energy (2016-03-18). "2016 Volvo XC90 AWD PHEV". Fueleconomy.gov. Retrieved 2016-03-18.
- 1 2 U. S. Environmental Protection Agency and U.S. Department of Energy (2015-12-18). "Compare Side-by-Side - 2016/2015/2014 Porsche Panamera S E-Hybrid". Fueleconomy.gov. Retrieved 2015-12-19.
- ↑ U. S. Environmental Protection Agency and U.S. Department of Energy (2015-12-18). "Compare Side-by-Side - 2016/2015 Porsche Cayenne S E-Hybrid". Fueleconomy.gov. Retrieved 2015-12-19.
- 1 2 U. S. Environmental Protection Agency and U.S. Department of Energy (2015-12-18). "Compare Side-by-Side - 2015/2014 McLaren Automotive P1". Fueleconomy.gov. Retrieved 2015-12-19.
- 1 2 United States Environmental Protection Agency and U.S. Department of Energy (November 2016). "Compare Fuel Cell Vehicles". fueleconomy.gov. Retrieved 2016-11-24. One kg of hydrogen is roughly equivalent to one U.S. gallon of gasoline.
- ↑ "Honda FCX Clarity Fuel Cell Vehicle Lease Program Begins with First Customer Delivery". Honda. 2008. Retrieved 2008-12-02
- ↑ "HFCIT Hydrogen Storage: Basics". United States Department of Energy. 2007. Retrieved 2008-12-02