Metropoolregio Eindhoven
| Eindhoven Metropolitan Region Metropoolregio Eindhoven | |
|---|---|
| Metropolitan region | |
| Metropoolregio Eindhoven | |
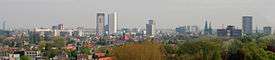 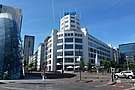 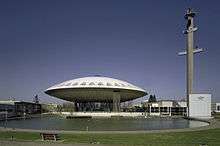 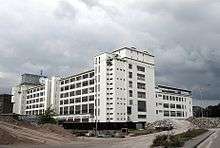 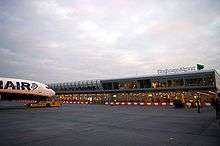 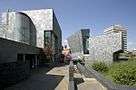  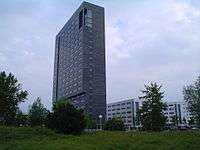 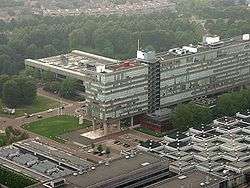 From top down, left to right: Skyline of Eindhoven, Light Tower at the city centre, Evoluon conference centre, Philips Clock Building at Strijp-S, Eindhoven Airport, Van Abbe Museum, Philips Stadium of PSV Eindhoven, ASML headquarters, Eindhoven University of Technology, High Tech Campus Eindhoven | |
 | |
| Coordinates: 51°26′00″N 5°29′00″E / 51.433333°N 5.483333°ECoordinates: 51°26′00″N 5°29′00″E / 51.433333°N 5.483333°E | |
| Country |
|
| Province |
|
| Largest Cities |
Eindhoven Helmond |
| Other Municipalities | |
| Area | |
| • Metro region | 1,457.81 km2 (562.86 sq mi) |
| • Urban[lower-alpha 1] | 321.86 km2 (124.27 sq mi) |
| • Municipality | 88.87 km2 (34.31 sq mi) |
| Population (31 August 2015)[1][2][3] | |
| • Metro region | 755,313 |
| • Density | 520/km2 (1,300/sq mi) |
| • Urban | 422,666 |
| • Urban density | 1,300/km2 (3,400/sq mi) |
| • Municipality | 224,300 |
| • Municipality density | 2,500/km2 (6,500/sq mi) |
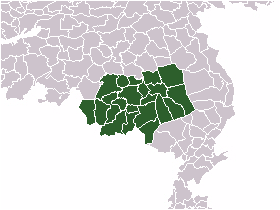
The Metropoolregio Eindhoven (MRE; English: Eindhoven Metropolitan Region), until 1 January 2014 the Samenwerkingsverband Regio Eindhoven (SRE; English: Cooperative union for the Region of Eindhoven) is a regional governmental agency for the city region of Eindhoven, Netherlands. The MRE comprises 21 municipalities in the Eindhoven agglomeration, with a total area of 1,457.81 square kilometers. The region has nearly three quarters of a million inhabitants and some 35.000 companies (employing over 330.000 people).
Organizational structure
The MRE is a city region, which means that it is primarily a cooperation of municipalities (it also means that the MRE mandatorily carries out certain tasks for the municipalities, in the form of a joint administration). Final control over the MRE lies with the Regional Council (Dutch: Regioraad), which consists of representatives of the participating municipalities (either mayors or aldermen). The Council sets the general parameters and long-term guidelines within which the MRE operates. The Council also provides overview of the Daily Management, which is responsible for the daily running of the MRE.
The MRE is involved with many areas of administration that are cross-border concerns for the member municipalities. In order to facilitate this, the responsible aldermen for these areas meet six times a year in a meeting.
The Daily Management runs three separate services of the MRE:
- The MRE (the service which carries out the joint administration)
- The MRE Environmental Service, which assists the municipalities in environmental and regional planning
- The Regional Historic Center of Eindhoven
The Environmental Service is the largest of the MRE bodies.
In the area of administration, the MRE has three types of responsibilities:
- City region responsibilities. These are responsibilities that have been appointed to the MRE by mandate of being a city region (that is, the law delegates them to the MRE). Examples of these responsibilities are contracting public transportation and child care. Most of these responsibilities have been moved to the MRE from the province.
- Responsibilities as an extension to municipal administration. These are responsibilities that all member municipalities have delegated jointly to the MRE.
- Responsibilities that one or more member municipalities have unilaterally delegated to the MRE.
Public transportation
The City and Regional Transportation in North-Brabant is not entirely the legidomain of the province of North-Brabant. Being a city region, MRE is the concession granter for public transportation in the southeast of the province. The current concession holder is Hermes.[4] The MRE also commissioned the creation of the Phileas, a guided bus which runs on the rapid transit lines to Meerhoven, Eindhoven Airport and Veldhoven.[5]
Municipalities
| Municipality | Population |
|---|---|
| Asten | 16743 |
| Bergeijk | 18411 |
| Best | 29452 |
| Bladel | 20123 |
| Cranendonck | 20674 |
| Deurne | 32116 |
| Eersel | 18723 |
| Eindhoven | 227751 |
| Geldrop-Mierlo | 39284 |
| Gemert-Bakel | 30252 |
| Heeze-Leende | 15826 |
| Helmond | 90581 |
| Laarbeek | 22088 |
| Nuenen | 22885 |
| Oirschot | 18599 |
| Reusel-De Mierden | 12962 |
| Someren | 19166 |
| Son en Breugel | 16763 |
| Valkenswaard | 30615 |
| Veldhoven | 44884 |
| Waalre | 17031 |
| Total[6] | 749,841 |
See also
- BrabantStad
- Brabant metropolitan area
- Uden-Veghel
- Breda-Tilburg (nl)
- Bergen op Zoom-Roosendaal (nl)
References
- ↑ Stadsgewest Eindhoven
87,72km2 – Eindhoven
55,01km2 – Valkenswaard
34,31km2 – Best
33,72km2 – Nuenen
31,73km2 – Veldhoven
31,02km2 – Geldrop-Mierlo
25,95km2 – Son en Breugel
22,40km2 – Waalre
+321,86 km2
- ↑ "Bevolkingsontwikkeling; regio per maand" [Population growth; regions per month]. CBS Statline; Municipality (in Dutch). CBS. 31 August 2015. Retrieved 13 October 2015.
- ↑ "Bevolkingsontwikkeling; regio per maand" [Population growth; regions per month]. CBS Statline; Urban area (in Dutch). CBS. 31 August 2015. Retrieved 13 October 2015.
- ↑ "Bevolkingsontwikkeling; regio per maand" [Population growth; regions per month]. CBS Statline; Metro region (in Dutch). CBS. 31 August 2015. Retrieved 13 October 2015.
- ↑ "Public transport - Eindhoven". Eindhoven.info (in Dutch). Retrieved 15 September 2018.
- ↑ OECD, China Development Research Foundation (2010). Trends in urbanisation and urban policies in OECD countries : what lessons for China?. OECD. ISBN 9789264092259. Retrieved 15 September 2018.
- ↑ "Bevolkingsontwikkeling; regio per maand" [Population growth; regions per month]. CBS Statline (in Dutch). CBS. 27 October 2017. Retrieved 27 October 2017.
External links
- Metropoolregio Eindhoven (in Dutch)
- Samenwerkingsverband Regio Eindhoven (in Dutch)
- Provinciaal Uitwerkingsplan/Regionaal Structuurplan Zuidoost-Brabant (Plantekst)
- Provinciaal Uitwerkingsplan/Regionaal Structuurplan Zuidoost-Brabant (Plankaart)