Lombard regional election, 2005
|
| |||||||||||||||||||||||||||||||
| |||||||||||||||||||||||||||||||
All 80 seats to the Regional Council of Lombardy | |||||||||||||||||||||||||||||||
|---|---|---|---|---|---|---|---|---|---|---|---|---|---|---|---|---|---|---|---|---|---|---|---|---|---|---|---|---|---|---|---|
| Turnout |
72.97% ( | ||||||||||||||||||||||||||||||
| |||||||||||||||||||||||||||||||
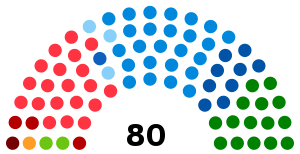 Composition of the Regional Council | |||||||||||||||||||||||||||||||
| |||||||||||||||||||||||||||||||

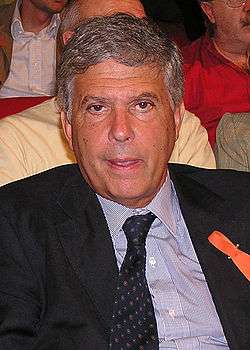
The Lombard regional election of 2005 took place on 3–4 April 2005. The 8th term of the Regional Council was chosen. Roberto Formigoni (Forza Italia) was re-elected for the third time in a row President, defeating Riccardo Sarfatti.
Electoral law
Lombardy uses national Tatarella Law of 1995 to elect its Council, not having written its own legislation. Sixty-four councillors are elected in provincial constituencies by proportional representation using the largest remainder method with a Droop quota and open lists; remained seats and votes are grouped at regional level where a Hare quota is used, and then distributed to provincial party lists.
Sixteen councillors are elected at-large using a general ticket: parties are grouped in alliances, and the alliance which receives a plurality of votes elects all its candidates, its leader becoming the President of Lombardy. If a coalition wins more than 50% of the total seats in the Council with PR, only 8 candidates from the regional list will be chosen and the number of those elected in provincial constituencies will be 72; if the winning alliance receives less than 50% of votes, special seats are added to the Council to ensure a large majority for the President's coalition.
Council apportionment
According to the official 2001 Italian census, the 64 Council seats which must be covered by proportional representation were so distributed between Lombard provinces.
| BG | BS | CO | CR | LC | LO | MN | MI | MB | PV | SO | VA | total |
|---|---|---|---|---|---|---|---|---|---|---|---|---|
| 7 | 8 | 4 | 2 | 2 | 1 | 3 | 21 | 5 | 4 | 1 | 6 | 64 |
It must be underlined that this allocation is not fixed. Remained seats and votes after proportional distribution, are all grouped at regional level and divided by party lists. The consequent division of these seats at provincial level usually change the original apportionment. Only 37 seats were directly assigned at provincial level, and the final distribution between provinces changed in this way.
| BG | BS | CO | CR | LC | LO | MN | MI | MB | PV | SO | VA | total |
|---|---|---|---|---|---|---|---|---|---|---|---|---|
| +1 | +1 | -1 | = | = | = | -1 | +2 | -1 | -1 | -1 | = | -1 |
As it can be seen, the Province of Sondrio remained without representation.
Results
2005 election led to the return to the guide of the Region, for its third consecutive term, Communion and Liberation's Roberto Formigoni, supported by the center-right coalition.
If the mechanisms of electoral law generated a Regional Council very similar to the incumbent one, popular vote marked a significant reduction in the gap between the two sides, which was almost halved. The same plurality party, Forza Italia, decreased of more than four hundred preferences. The election was also the test for a list that led, within two years, to the national foundation of a new political entity, the Democratic Party.
The Olive Tree, an alliance comprising The Daisy and the Democrats of the Left, was the largest party in the region for the first time with the 27.1% of votes.
| |||||||||||
| Candidate | Regional lists | Provincial lists | Total | ||||||||
|---|---|---|---|---|---|---|---|---|---|---|---|
| votes | % | seats | Party | votes | % | swing | seats | party | group | ||
| Roberto Formigoni | 2,841,883 | 53.86 | 16 | Forza Italia | 1,137,621 | 25.95 | 18 | 25 | 52 | ||
| Northern League–Lombard League | 693,464 | 15.82 | 11 | 15 | |||||||
| National Alliance | 380,962 | 8.69 | 5 | 9 | |||||||
| Union of Christian and Centre Democrats | 166,761 | 3.80 | 2 | 3 | |||||||
| New Italian Socialist Party | 36,616 | 0.84 | - | - | - | ||||||
| Liberal Democrats–PRI–PLI | 11,196 | 0.26 | - | - | - | ||||||
| Riccardo Sarfatti | 2,278,173 | 43.17 | 1 | The Olive Tree | 1,186,848 | 27.07 | 19 | 20 | 28 | ||
| Communist Refoundation Party | 248,703 | 5.67 | 3 | 3 | |||||||
| Federation of the Greens | 128,060 | 2.92 | 2 | 2 | |||||||
| Pensioners' Party | 115,481 | 2.63 | 1* | 1 | |||||||
| Party of Italian Communists | 104,481 | 2.38 | 1 | 1 | |||||||
| Italy of Values | 61,431 | 1.40 | 1 | 1 | |||||||
| Gianmario Invernizzi | 142,807 | 2.71 | - | Social Alternative | 54,937 | 1.25 | - | - | - | ||
| Lega Padana Lombardia | 39,012 | 0.89 | - | - | - | ||||||
| Pensions & Work | 7,409 | 0.17 | - | - | - | ||||||
| Marco Marsili | 14,008 | 0.27 | - | Liberal Democrats | 11,579 | 0.26 | - | - | - | - | |
| Total candidates | 5,276,871 | 100.00 | 17 | Total parties | 4,384,561 | 100.00 | = | 63 | 80 | 80 | |
* Pensioners gave a seat to Sarfatti.
Source: Ministry of the Interior
Results by province
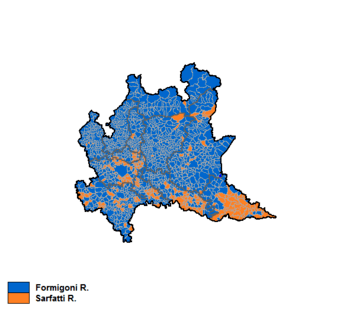
| Province | Roberto Formigoni | Riccardo Sarfatti | Turnout |
|---|---|---|---|
| Milan | 821,495 (48.74%) | 814,934 (48.36%) | 71.02% |
| Brescia | 368,705 (56.90%) | 253,080 (39.06%) | 75.16% |
| Bergamo | 347,263 (60.33%) | 214,510 (37.27%) | 74.52% |
| Varese | 276,137 (58.39%) | 184,599 (39.03%) | 71.51% |
| Monza and Brianza | 243,210 (54.49%) | 193,080 (43.26%) | 75.56% |
| Como | 200,396 (62.06%) | 113,623 (35.19%) |
72.51% |
| Pavia | 158,119 (52.65%) | 130,671 (43.51%) |
74.21% |
| Mantua | 103,207 (45.93%) | 116,766 (51.97%) |
74.07% |
| Cremona | 100,900 (50.45%) |
91,718 (45.86%) |
75.15% |
| Lecco | 99,286 (53.54%) |
79,452 (42.85%) |
75.37% |
| Lodi | 59,923 (50.19%) |
55,364 (46.37%) |
75.50% |
| Sondrio | 63,242 (65.91%) |
30,376 (31.66%) |
64.02% |
Results by capital city
| City | Roberto Formigoni | Riccardo Sarfatti | Turnout |
|---|---|---|---|
| Milan | 339,015 (49.80%) |
326,009 (47.89%) |
67.62% |
| Brescia | 55,968 (50.76%) |
51,312 (46.54%) |
75.52% |
| Monza | 37,170 (52.18%) |
32,675 (45.89%) |
74.08% |
| Bergamo | 36,453 (54.73%) |
29,072 (43.65%) |
73.12% |
| Como | 26,605 (56.56%) |
19,291 (41.01%) |
70.00% |
| Varese | 26,594 (58.62%) |
17,944 (39.55%) |
68.95% |
| Pavia | 22,852 (50.85%) |
20,930 (46.58%) |
77.88% |
| Cremona | 18,937 (45.75%) |
21,319 (51.50%) |
73.22% |
| Mantua | 11,639 (40.11%) |
16,902 (58.25%) |
75.52% |
| Lecco | 13,961 (52.54%) |
11,964 (44.85%) |
72.71% |
| Lodi | 13,495 (52.19%) |
11,511 (44.52%) |
78.18% |
| Sondrio | 6,839 (56.60%) |
4,993 (41.32%) |
67.32% |
References
| Regional elections | |
|---|---|
| General elections | |
| Senate elections | |
| European elections | |
| Referendums | |