List of information graphics software
This is a list of software to create any kind of information graphics:
- either includes the ability to create one or more infographics from a provided data set
- either it is provided specifically for information visualization
| Software | Example(s) | Interface | Licence(s) | Latest Release | Operating system | Distinguishing features | ||
|---|---|---|---|---|---|---|---|---|
| License | Open Source (yes/no) | Price | ||||||
| AIDA | LGPL | Yes | Free | October 2003 / 3.2.1 | Open interfaces and formats for particle physics data processing | |||
| Algebrator | GUI | Proprietary | No | $58.99 | 2009 / 4.2 | Linux, Mac OS X, Sugar, Windows | 2D graphs | |
| AnyChart | charts, maps, stock charts, Gantt charts | JavaScript library, GUI | Proprietary[1] | No | $79 | October 31, 2016 / 7.12.0 | All platforms/OS, all browsers | Flexible; JavaScript (HTML5) based; interactive; real-time updates; multi-level drill-downs; various types of charts, maps, stock charts, Gantt charts, dashboards. |
| Archim | drawing 2D and 3D graphs | freeware | No | Free | 2008 | Windows | Graphs in polar (or other) coordinates become specific cases of parametric graphs. | |
| Baudline |  | GUI | Proprietary/GPL | No | Free | July 21, 2010 / 1.08 | FreeBSD, Linux, Mac OS X, Solaris | Signal analysis tool |
| ChartDirector |  | C++ (command line, Qt, MFC), .NET (C#, VB), Java, COM, VB6, VBA, VBScript, Javascript, PHP, Python, Perl, Ruby, ColdFusion | Proprietary | No | $99 – $749 | June 15, 2015 / 6.0 | Windows, Linux, FreeBSD, Mac OS X, Solaris, Any (Java edition) | Extensive chart types; Realtime charts; Handles large data sets; Cross-platform; Command line, web and desktop usage; PDF, SVG and image outputs. |
| D3js | JavaScript library | BSD | Yes | Free | August 25, 2018 / 5.7.0 | web browsers, js engines | static and dynamic presentations | |
| DADiSP | 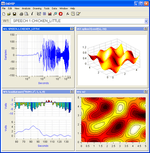 | GUI, command line, SPL script language | Proprietary | No | January 17, 2017 / 6.7 B02 | Windows | Numerical analysis and signal processing with a spreadsheet-like interface | |
| DAP | GNU-style copyleft[2] | Yes | Free | April 16, 2014 / 3.10 | Statistics | |||
| Datacopia | 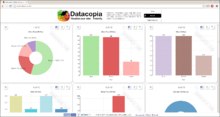 Sample charts created through datacopia | GUI (web based) | Freemium | No | Free, $4.99 – $29.99 | Windows, Linux, Mac, iOS, Android | Generates a ranked list of several plots & visualizations based on an analysis of the data provided, allowing the user to choose their favorite graphic, share it, and export it as an image. | |
| DataScene | GUI | Shareware | No | Free express, $169 – $299 std. and pro. | March 2011 / 3.0.7 | Linux, Unix/X11, Windows | 2D & 3D graphing, animated graphs, data analysis, curve fitting, and data monitoring. | |
| Descartes (plotting tool) | GUI | GPL | Yes | Free | July 10, 2005 / 0.7 | Any (Python) | Inactive as of 2005 | |
| EditGrid | GUI (web based) | Free, or with subscription service | Any (Web-based application) | Online spreadsheet; service due to end May 1, 2014 | ||||
| EJS |  | GUI | GPL | Yes | Free | Linux, Mac OS X, Windows | Creates ODE solving interactive, ready-to-publish Java applets | |
| Epi Info | GPL | Yes | Free | February 2, 2018 / 7.2.2.6 | Windows | Statistics | ||
| EViews | Proprietary | No | June 21, 2017 / 10 | Statistics | ||||
| Fityk | 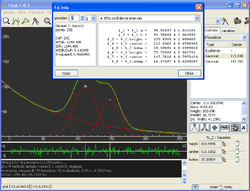 | GUI, command line | GPL | Yes | €90 - €225 | December 19, 2016 / 1.3.1 | Linux, Mac OS X, Windows | specialized in curve fitting |
| FlexPro | Proprietary | No | 2017 | MS Windows only | ||||
| FreeMat |  | GPL[3] | Yes | Free | June 30, 2013 / 4.2 | Linux, Mac OS X, Windows | ||
| FusionCharts | 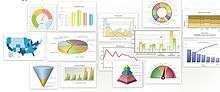 Create Interactive Charts and Graphs | GUI (web based), JavaScript Charting Library | Proprietary | No | Free for Personal Use, $1,299 – $9,999 | November 1, 2016 / 3.11.3 | All Web Browsers (including IE 6), JS Engines | Interactive JavaScript Charts for your Web & Mobile applications. Get 90+ chart types and 965 maps, readymade business dashboards and demos. |
| GeoGebra | 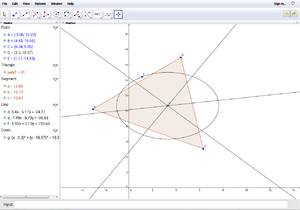 | GUI | GPL[4] | Yes | Free | September 3, 2017 / 6.0.385.0 | Linux, Mac OS X, Sugar, Windows | Very good for rendering Geometry, Graphs, Statistical Diagrams, (LaTeX) Formula Rendering. All antialiased in PNG Export. Export to SVG, EPS, EMF, PNG, PDF. |
| Gephi | 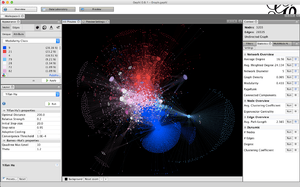 | GUI | GPLv3 / CDDL 1.0 | Yes | Free | February 14, 2016 / 0.9.1 | Linux, Mac OS X, Windows | Networks and complex systems, dynamic and hierarchical graphs |
| ggplot2 | R | GPL2 | Yes | Free | December 30, 2016 / 2.2.1 | Cross-platform | Based on "The Grammar of Graphics" | |
| Gnumeric | GUI | GPL[5] | Yes | Free | August 19, 2018 / 1.12.43 | Cross-platform | Spreadsheet | |
| GNU Octave | 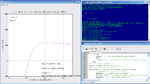 | GUI, command line, C, C++, Fortran | GPL | Yes | Free | August 9, 2018 / 4.4.1 | eComStation, FreeBSD, Linux, Mac OS X, OS/2, Solaris or Windows | MATLAB compatible, built-in ODE and DAE solvers, extensive user contributed toolboxes |
| Gnuplot |  | Command line, Python, Ruby, Smalltalk, third-party GUIs | Own license | Yes | Free | June 4, 2018 / 5.2.4 | Amiga, Atari ST, BeOS, Linux, Mac, MS-DOS, OS/2, OS-9/68k, Ultrix, Windows, VMS | Built in scripting language |
| GrADS | command line | GPL | Yes | Free | April 25, 2018 / 2.2.1 | Linux, Mac OS X, Windows, Solaris, IBM AIX, DEC Alpha, IRIX | Visualization of Earth science data | |
| GLE | Command line, GUI | BSD / GPL | Yes | Free | August 18, 2015 / 4.2.5f | Linux, Mac, Windows | Graphics scripting language | |
| GraphPad Prism | GUI | proprietary | No | academic US$450, student US$300 | October 12, 2016 / 7.0b | Mac, Windows | ||
| Grace | 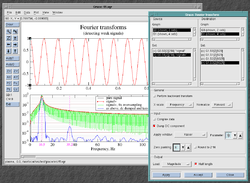 | Command line, GUI, various APIs | GPL | Yes | Free | February 14, 2015 / 5.1.25 | Linux, Mac(X11), Windows (cygwin) | Uses Motif; fork of Xmgr |
| Graphviz | DOT language | CPL | Yes | Free | December 25, 2016 / 2.40.1 | Linux, Mac OS X, Windows | ||
| gretl | GUI | GPL | Yes | Free | September 3, 2018 / 2018c | Linux, Mac, Windows | Specialized in econometrics and time series analyses, built-in scripting language, interface to gnuplot and R | |
| HippoDraw | GPL v2 | Yes | Free | October 2007 / 1.21.3 | C++-based data analysis system | |||
| IDPS | GUI, Fortran, C, Python, Socket Server | GPL | Yes | Free | Linux, Mac OS X, OSF1/True64, Solaris, Windows | Uses Qt 3/Qt 4, runs as a server | ||
| IGOR Pro | 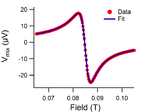 | GUI | proprietary | No | Non-free standard US$550 academic US$395 student $US85 | January 27, 2017 / 7.0.2 | Mac, Windows | 3D and volume visualization, Curve and peak fitting, Signal processing, Image processing |
| ILNumerics | Math library for .NET / C# | GPL / proprietary | free / €999 | June 11, 2015 / v4.8 | Windows and Linux | Math library with rich visualization features (interactive 3D scenes, scientific plotting) and Matlab-like syntax. | ||
| Ipe | 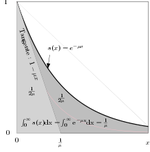 | GUI, XML | GPL | Yes | Free | December 10, 2016 / 7.2.7 | Linux, Mac, Windows, OS/X | IPE Graphics with LaTeX equations or notations can be stored as PDF files (not only exported to PDF) and be included in LaTeX documents. pdftoipe allows any PDF graph to be edited in Ipe. |
| JFreeChart |  | GUI, Java, Groovy | LGPL | Yes | Free | November 5, 2017 / 1.5.0 | Any (Java) | |
| KChart |  | GUI | GPL | Yes | Free | March 21, 2017 / 3.0.1 | Linux (KDE) | |
| Kig | GUI | GPL | Yes | Free | Geometry diagrams only | |||
| kst | 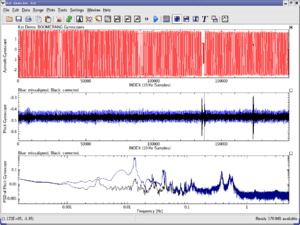 | GUI | GPL | Yes | Free | July 20, 2014 / 2.0.8 | Linux (KDE), Windows (beta) | |
| LabPlot |  | GUI, Qt scripting | GPL | Yes | Free | June 21, 2018 / 2.5.0 | Linux (KDE) | |
| LabVIEW | Proprietary | No | $999–9699 | May 2017 / 2017 | Visual circuits modeling | |||
| LiSiCA | 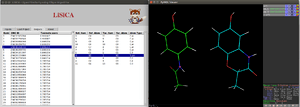 | Python | No | Free | Windows, Linux | Ligand-based virtual screening software that searches for 2D and 3D similarities between a reference compound and a database of target compounds. | ||
| MagicPlot | GUI | Proprietary | No | Student ed.: freeware Pro ed.: $149 ($74.50 Academic) | September 18, 2016 / 2.7.2 | Any (Java) | Nonlinear fitting, batch processing | |
| Maple |  | GUI, command line | Proprietary | No | Student US$99, Academic US$995, Government US$2,265, Commercial US$2,390 | May 25, 2017 / 2017 | Linux, Mac OS X, Windows | |
| MathCad | GUI | Proprietary | No | $1195 | March 6, 2017 / Prime 4.0, November 2015 / 15.0 M045 | Windows | Simple GUI driven interface | |
| Mathematica |  | GUI, command line, C++ | Proprietary | No | Personal US$295, Government US$2,870, Commercial US$3,185 | 11.3.0 (March 8, 2018) [±][6] | Linux, Mac OS X, Windows, Raspberry Pi[7] | Computer algebra, statistics and numerical analysis system with general graphic language. See Wolfram Language. |
| MATLAB |  | GUI | Proprietary | No | September 20, 2017 / R2017b | Linux, Mac OS X, Windows | Matrix system | |
| Maxima | GUI, command line | GPL | Yes | Free | October 3, 2017 / 5.41.0 | BSD, Linux, Mac OS X, Unix Like OS, Windows | Various graphical user interfaces, Support LaTex with GNU TeXmacs and Web frontend with SageMath | |
| MayaVi |  | GUI, Python, scriptable, embeddable | BSD | Yes | Free | August 3, 2018 / 4.6.2 | GNU/Linux, Mac OS X, Windows | Visualises computational grids, scalar/vector/tensor data. Texture & ray-cast mappers. |
| MedCalc | GUI | Proprietary | No | $395 | August 17, 2017 / 17.9 | Windows | Statistics | |
| Microsoft Excel | GUI | Proprietary | No | Mac OS X, Windows | Spreadsheet | |||
| NCSS (statistical software) | GUI | Proprietary | No | $429 | May 2, 2016 / NCSS 11 | Windows | Statistical Analysis and Statistical Graphics software | |
| Nucalc | GUI | proprietary | No | Non-freeUS$100[8] | Mac OS, Mac OS X, Windows | |||
| Numbers (iWork) | GUI | Proprietary | No | March 28, 2017 / 4.1 | Mac OS X | Spreadsheet | ||
| OpenDX | GUI | Proprietary | No | January 19, 2006 / 4.4.0 | Cross-platform | |||
| OpenOffice.org Calc | GUI | GNU LGPL | Yes | Free | January 25, 2011 / 3.3 | Cross-platform | Spreadsheet | |
| OpenPlaG |  | GUI | GPL | Yes | Free | June 12, 2018 / 3.5 | Any (PHP 5) | graph plotter |
| Orange |  | GUI, Python scripting | GPL | Yes | Free | September 3, 2017 / 3.5 | GNU/Linux, Windows, Mac OS X | A visual programming data-flow software suite with widgets for statistical data analysis, interactive data visualization, data mining, and machine learning. |
| Origin | GUI, COM, C/C++ and scripting | proprietary | No | Non-freeUS$ 1095 (std) 1800 (pro) 850 (academic pro) 69/yr. (student)[8] | June 22, 2017 / 2017 SR2 | Windows | Multi-layer 2D, 3D and statistical graphs for science and engineering. Built-in digitizing tool. Auto-recalculation and reporting. Programmable, with access to NAG Numerical Library. | |
| ParaView | GUI, Python scripting | GPL | Yes | Free | June 19, 2018 / 5.5.2 | Linux/Unix, Mac OS X, Windows | Parallel scientific and Computational Fluid Dynamics visualizations | |
| PDL | 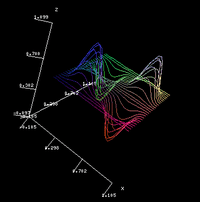 | Artistic License / GPL | Yes | Free | May 6, 2018 / 2.019 | Perl Data Language | ||
| PGPLOT | FORTRAN, C | No | Free for non commercial | February 26, 2001 / 5.2.2 | Linux, Mac, Windows | (Fortran) California Institute of Technology, Inactive as of 2001 | ||
| ploticus |  | Command line, C | GPL | Yes | Free | May 2013 / 2.42 | Linux, Mac, Windows | plots and charts from data |
| Plotly | 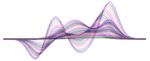 | GUI, command line Python | Commercial | No | Free | Any (web-based) | plots and charts in browser, web-sharing and exporting, drag-and-drop data import, Python command line | |
| plotutils | command line, C/C++ | GPL | Yes | Free | September 27, 2009 / 2.6 | Linux, Mac, Windows | Collection of command line programs, C/C++ API | |
| PLplot | 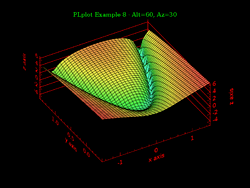 | Ada, C/C++/D, Fortran 77/90, C, C++, Java, Lisp, Lua, OCaml, Octave, Perl, Python, Tcl/Tk | LGPL | Yes | Free | August 26, 2017 / 5.13.0 | Linux, Mac, Windows | Many different output formats: CGM, GIF, Jpeg, Png, Latex, PBM, PDF, Postscript, SVG, XFig, Qt, wxWidgets |
| PSPP | GUI, command line | GPL | Yes | Free | August 20, 2017 / 1.0.0 | Linux, Mac, Windows | Statistical analysis of sampled data. Free replacement for SPSS. | |
| QtiPlot | GUI, Python | proprietary | No | Non-free. Various rates for Annual subscriptions[9] | May 31, 2017 / 0.9.9.11 | Linux, Mac, Windows | Python scriptable | |
| R | 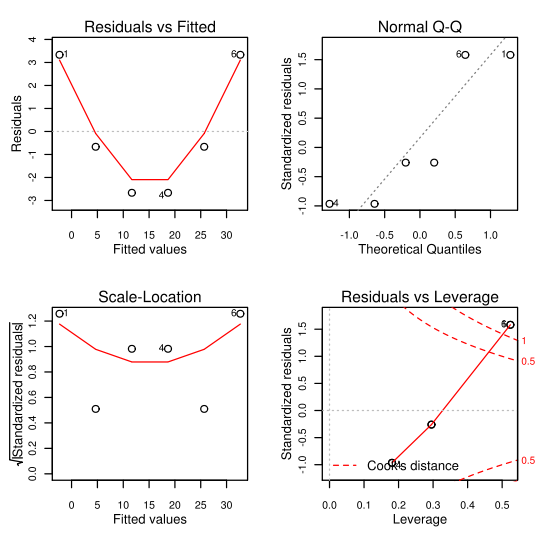 | Third party | GPL | Yes | Free | July 2, 2018 / 3.5.1("Feather Spray") | Linux, Mac, Windows | In addition to base graphics, has a large number of graphics packages including lattice and ggplot2.[10] Interoperabile with other free software packages. |
| ROOT |  | GUI, C++, Python, Ruby | LGPL | Yes | Free | August 23, 2018 / 6.14.04 | Linux, Mac, Windows | De facto standard in high energy physics |
| RRDtool |  | Command line | GPL | Yes | Free | May 17, 2017 / 1.7.0 | Linux, Windows | |
| S-PLUS | Proprietary | No | November 2010 / 8.2 | Statistics | ||||
| S | Statistics | |||||||
| SAS System | Proprietary | No | July 10, 2013 / 9.4 | Statistics | ||||
| Scilab |  | CeCILL | Yes | Free | February 15, 2018 / 6.0.1 | Linux, Mac OS X, Windows | Matrix system | |
| SciPy, NumPy, matplotlib modules for Python |  | Python, GUI, command line | BSD/matplotlib | Yes | Free | June 21, 2017 / 0.19.1, July 6, 2017 / 1.13.1, May 10, 2017 / 2.0.2 | FreeBSD, Linux, Mac OS X, Windows | Extensive numerical and scientific library with MATLAB-style plotting |
| Simple Grapher | GUI | Proprietary | No | Free | Microsoft Windows | 2D and 3D Graph | ||
| SOCR | Statistics | |||||||
| Sonic Visualiser | GUI | GPL | Yes | Free | August 14, 2018 / 3.1.1 | Linux, MacOS, Windows | ||
| SPSS | GUI, command line | Proprietary | No | August 8, 2017 / 25.0 | Statistics | |||
| Stata | Proprietary | No | June 6, 2017 / 15.0 | Statistics | ||||
| Statgraphics | 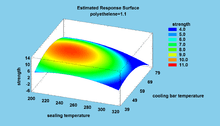 Dynamic Response Surface Plot | GUI | Proprietary | No | $30–$2,414 | July 2015 / 17.1.08 | Windows | Statistical software package for exploratory data analysis, dynamic data visualization, statistical modeling, design of experiments, time series forecasting, quality improvement and Six Sigma. |
| Statistical Lab | May 2, 2011 / 3.81 | |||||||
| Systat | Proprietary | No | Statistics | |||||
| SymPy | 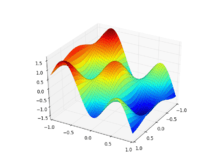 | BSD | Yes | Free | September 14, 2018 / 1.3 | Linux, Mac OS X, Windows | Python library for computer algebra and symbolic mathematics | |
| Sysquake | GUI, command line | Proprietary | No | $250 (LE free) | November 5, 2013 / 5.0 | Linux, Mac OS X, Windows | MATLAB compatible, interactive graphics | |
| SciDAVis | 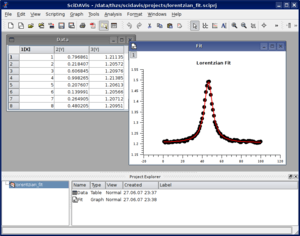 | GUI, Python | GPL | Yes | Free | June 4, 2018 / 1.23 | Linux, Mac, Windows | Qt4-based GUI, Python scriptable |
| SigmaPlot | GUI | proprietary | No | Non-freeCommercial US$799, Government US$699, Commercial US$549 | 2014 / 13.0.0 | Windows | ||
| TAChart | 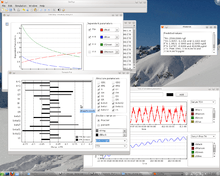 | Charting library | modified LGPL | Yes | Free | November 13, 2016 / 1.6.2 | Linux, Mac OS X, Windows | Very flexible charting component for Lazarus / Free Pascal. |
| Tableau | GUI | Proprietary | No | $999 – $1800 | Windows | Spreadsheet | ||
| Tecplot | 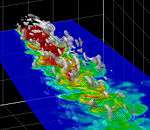 | GUI | proprietary | No | /360/purchase.aspx varies | 2016 / 2016 | Linux, Mac, UNIX, Windows | Computational Fluid Dynamics |
| Teechart | 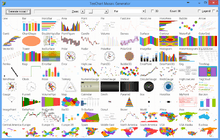 | Charting library | Open Source | Yes | Free | 2018 | Windows, macOS, Linux, iOS, Android | Full set of chart types, maps & gauges, interactive, real-time, PNG, JPEG export, cross-browser support, integration with WordPress, Drupal, Node.js, Joomla, TypeScript, NuGet among others. |
| think-cell chart | GUI | proprietary | No | Annual subscription | Windows | Support for waterfall, Marimekko and Gantt charts. Direct integration into Microsoft PowerPoint. | ||
| Veusz | 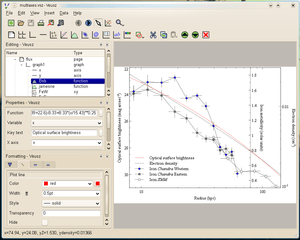 | GUI, Python, command line | GPL | Yes | Free | July 22, 2018 / 3.0.1 | Mac, Unix, Windows | Create publication-quality PS/PDF plots, Python scripting and plugin interface |
| Visifire | Independent of server side scripting | Proprietary | No | $149 | June 5, 2014 / 5.1.7-0 | Mac, Windows | ||
| VisIt |  | GUI, C++, Python, and Java | BSD | Yes | Free | May 2018 / 2.13.2 | Linux, Mac, Windows | Designed to handle very large data sets |
| Webix | JavaScript library | GPLV3/Proprietary[11] | Yes | $469 | June 27, 2017 / 4.4 | Cross platforms, cross browsers | JavaScript/HTML5 based; More than 75 widgets and controls; Maps; Charts; DataTables; Organograms; Gauge charts | |
| World Programming System (WPS Analytics) | GUI, command line | Proprietary | No | March 2018 / 4.0 | AIX, Linux, Linux for Arm8 64-bit (AArch64), macOS, PowerLinux, POWER/System p/pSeries (LE), Solaris, Windows, Linux for System z, z/OS | Statistics. Handles very large data sets. Supports mixing Python, R, SAS and SQL languages within in a single user program | ||
| XGraph | GUI, command line | Proprietary | No | Free | April 2014 / v4.30 | Linux, Windows | Interactive and batch 2D data file plotting | |
| Zoho Office Suite | GUI (web based) | Proprietary | No | Any (web-based application) | Online spreadsheet | |||
Vector graphics
Vector graphics software can be used for manual graphing or for editing the output of another program. Please see:
- Category:Vector graphics editors
- Comparison of vector graphics editors
- List of vector graphics editors
A few online editors using vector graphics for specific needs have been created. This kind of creative interfaces work well together with data visualization tools like the ones above.
See also
- Comparison of numerical analysis software
- Diagramming software
- List of graphical methods
References
- ↑ AnyChart - Buy
- ↑ "The Dap Project for Statistics and Graphics". Retrieved 22 April 2016.
- ↑ "Homepage". FreeMat website. Archived from the original on 7 December 2013. Retrieved 13 January 2014.
- ↑ The International GeoGebra Institute (April 2013). "GeoGebra Non-Commercial License Agreement". GeoGebra website. Archived from the original on 13 January 2014. Retrieved 13 January 2014.
- ↑ "Welcome to Gnumeric!". Archived from the original on 16 December 2013. Retrieved 13 January 2014.
- ↑ "Mathematica Quick Revision History". Retrieved 2018-03-08.
- ↑ Raspberry Pi now includes Mathematica and Wolfram Language for free | The Verge
- 1 2 MSRP for full version. Discounted downloads and academic discounts might be available.
- ↑ QtiPlot pricing Archived 2013-01-27 at the Wayback Machine.
- ↑ https://cran.r-project.org/web/views/Graphics.html
- ↑ Webix - Buy
This article is issued from
Wikipedia.
The text is licensed under Creative Commons - Attribution - Sharealike.
Additional terms may apply for the media files.