JFreeChart
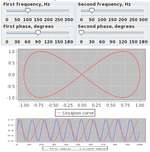 Lissajous figures, implemented with JFreeChart | |
| Developer(s) | Object Refinery Limited in collaboration with the community |
|---|---|
| Stable release |
1.5.0
/ November 5, 2017 |
| Repository |
|
| Written in | Java |
| Operating system | Cross-platform (JVM) |
| Type | Plotting Software |
| License | LGPL |
| Website | http://www.jfree.org/jfreechart/ |
JFreeChart is an open-source framework for the programming language Java, which allows the creation of a wide variety of both interactive and non-interactive charts.
JFreeChart supports a number of various charts, including combined charts:
- X-Y charts (line, spline and scatter). Time axis is possible.
- Pie charts
- Gantt charts
- Bar charts (horizontal and vertical, stacked and independent). It also has built-in histogram plotting.
- Single valued (thermometer, compass, speedometer) that can then be placed over map.
- Various specific charts (wind chart, polar chart, bubbles of varying size, etc.).
It is possible to place various markers and annotations on the plot.
JFreeChart also works with GNU Classpath, a free software implementation of the standard class library for the Java programming language.[1]
JFreeChart automatically draws the axis scales and legends. Charts in GUI automatically get the capability to zoom in with mouse and change some settings through local menu. The existing charts can be easily updated through the listeners that the library has on its data collections.
Relation with Eastwood Charts
Eastwood Charts is an open source implementation of the Google Chart API, with charts rendered using JFreeChart. Both Eastwood Charts and JFreeChart are under the terms of LGPL and developed by David Gilbert.[2]
Software Applications that use JFreeChart
Thoth: Software for Data Visualization and Statistics[3]
References
- ↑ "GNU Project Releases Latest Version of GNU Classpath" By: Enterprise Open Source News Desk. Oct. 22, 2007. SYS-CON Media.
- ↑ Eastwood Charts
- ↑ Laher, R. R. (2016). "Thoth: Software for data visualization & statistics". Astronomy and Computing. 17: 177-185.
External links
- http://www.jfree.org/jfreechart/ – project homepage
- cewolf - tag library for embedding JFreechart-generated charts in JSP pages
- JWebChart - charting servlet that renders JFreeChart-generated charts using URL