The National Hockey League is one of the top attended professional sports in the world, as well as one of the top two attended indoor sports in both average and total attendance. As of the 2017–18 season the NHL averaged 17,446 live spectators per game, and 22,174,263 total for the season.[1]
2017–18 attendance statistics
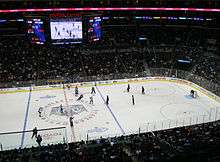
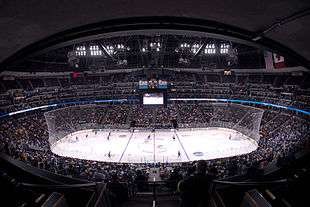
Little Caesars Arena
.jpg)
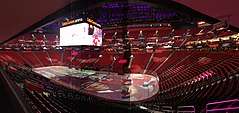
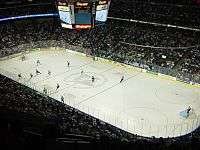
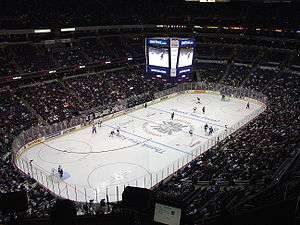
T-Mobile Arena
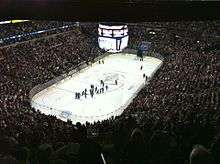
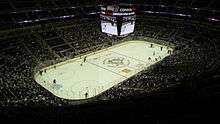
Bridgestone Arena
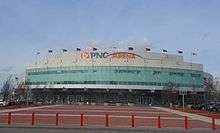
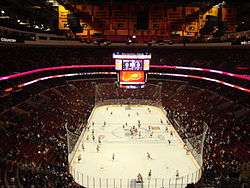
PNC Arena
| Team | Arena | Home Games | Average Attendance | Total Attendance | Capacity Percentage |
|---|
| Chicago Blackhawks |
United Center |
41 |
21,653 |
887,794 |
109.8%[2] |
| Montreal Canadiens | Bell Centre | 41 | 21,299 | 873,283 | 100.1% |
| Philadelphia Flyers | Wells Fargo Center | 41 | 19,517 | 800,214 | 99.9% |
| Detroit Red Wings | Little Caesars Arena | 41 | 19,515 | 800,115 | 100.0% |
| Toronto Maple Leafs | Air Canada Centre | 41 | 19,187 | 786,677 | 102.0% |
| Tampa Bay Lightning | Amalie Arena | 41 | 19,092 | 782,772 | 100.0% |
| Minnesota Wild | Xcel Energy Center | 41 | 19,036 | 780,501 | 106.0% |
| Calgary Flames | Scotiabank Saddledome | 41 | 18,905 | 775,105 | 98.0% |
| Washington Capitals | Capital One Arena | 40 | 18,774 | 740,240 | 104.0% |
| Pittsburgh Penguins | PPG Paints Arena | 41 | 18,579 | 761,764 | 101.0% |
| Buffalo Sabres | KeyBank Center | 41 | 18,563 | 719,283 | 99.8% |
| St. Louis Blues | Enterprise Center | 41 | 18,356 | 752,624 | 95.9% |
| Edmonton Oilers | Rogers Place | 41 | 18,347 | 752,227 | 98.4% |
| Los Angeles Kings | Staples Center | 41 | 18,240 | 747,845 | 100.1% |
| Dallas Stars | American Airlines Center | 41 | 18,110 | 742,511 | 97.7% |
| Vancouver Canucks | Rogers Arena | 41 | 18,078 | 741,233 | 95.6% |
| Vegas Golden Knights | T-Mobile Arena | 41 | 18,042 | 739,740 | 103.9% |
| New York Rangers | Madison Square Garden | 41 | 17,851 | 731,899 | 99.1% |
| Boston Bruins | TD Garden | 41 | 17,565 | 720,165 | 100.0% |
| San Jose Sharks | SAP Center | 41 | 17,365 | 711,988 | 98.9% |
| Nashville Predators | Bridgestone Arena | 41 | 17,307 | 709,597 | 101.1% |
| Columbus Blue Jackets | Nationwide Arena | 41 | 16,659 | 683,034 | 91.8% |
| Anaheim Ducks | Honda Center | 41 | 16,635 | 682,060 | 96.9% |
| Ottawa Senators | Canadian Tire Centre | 40 | 15,829 | 615,037 | 85.3% |
| Colorado Avalanche | Pepsi Center | 41 | 15,586 | 639,063 | 87.1% |
| Winnipeg Jets | Bell MTS Place | 41 | 15,321 | 628,161 | 102.1% |
| New Jersey Devils | Prudential Center | 41 | 15,200 | 623,240 | 92.0% |
| Florida Panthers | BB&T Center | 41 | 13,851 | 567,897 | 81.3% |
| Carolina Hurricanes | PNC Arena | 41 | 13,320 | 546,142 | 71.3% |
| Arizona Coyotes | Gila River Arena | 41 | 13,040 | 534,670 | 76.2% |
| New York Islanders | Barclays Center | 41 | 12,002 | 492,086 | 75.9% |
| Total | | 1,271 | 17,446 | 22,174,263 | |
Notes
- The Vegas Golden Knights began their inagural season at T-Mobile Arena in Paradise, Nevada during the 2017-18 season.
- The Detroit Red Wings began play at Little Caesars Arena during the season.
- The Verizon Center was renamed Capital One Arena
- The MTS Centre was renamed Bell MTS Place
- Totals do not include three outdoor regular season games.
- The Ottawa Senators hosted the Montreal Canadiens during the NHL 100 Classic, played at TD Place Stadium in Lansdowne Park, Ottawa, on December 16, 2017.
- The Buffalo Sabres and New York Rangers played during the 2018 NHL Winter Classic, played at Citi Field in Queens, New York, on January 1, 2018.
- The Washington Capitals hosted the Toronto Maple Leafs during the 2018 NHL Stadium Series, played at Navy-Marine Corps Memorial Stadium in Annapolis, Maryland on March 3, 2018.
2016–17 attendance statistics
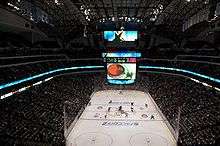
Rogers Place
Nationwide Arena
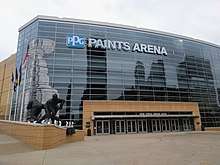
PPG Paints Arena

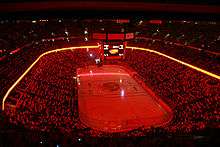
Scotiabank Saddledome
| Team | Arena | Home Games | Average Attendance | Total Attendance | Capacity Percentage |
|---|
| Chicago Blackhawks |
United Center |
41 |
21,751 |
891,827 |
110.3%[3] |
| Montreal Canadiens | Bell Centre | 41 | 21,288 | 872,808 | 100.1% |
| Detroit Red Wings | Joe Louis Arena | 41 | 20,027 | 821,107 | 100.0% |
| Pittsburgh Penguins | PPG Paints Arena | 41 | 19,762 | 810,273 | 110.2% |
| Toronto Maple Leafs | Air Canada Centre | 41 | 19,744 | 809,519 | 107.5% |
| Philadelphia Flyers | Wells Fargo Center | 41 | 19,644 | 805,408 | 100.5% |
| St. Louis Blues | Scottrade Center | 41 | 19,539 | 801,127 | 104.6% |
| Tampa Bay Lightning | Amalie Arena | 41 | 19,092 | 782,772 | 100.0% |
| Minnesota Wild | Xcel Energy Center | 41 | 19,070 | 781,879 | 106.2% |
| Calgary Flames | Scotiabank Saddledome | 41 | 18,727 | 767,829 | 97.1% |
| Vancouver Canucks | Rogers Arena | 41 | 18,509 | 758,891 | 97.9% |
| Washington Capitals | Verizon Center | 41 | 18,506 | 758,746 | 100.0% |
| Edmonton Oilers | Rogers Place | 41 | 18,347 | 752,227 | 98.4% |
| Los Angeles Kings | Staples Center | 41 | 18,240 | 747,858 | 86.0% |
| Buffalo Sabres | KeyBank Center | 41 | 18,141 | 743,819 | 94.0% |
| Dallas Stars | American Airlines Center | 41 | 18,102 | 742,163 | 97.7% |
| New York Rangers | Madison Square Garden | 41 | 18,020 | 738,828 | 100.1% |
| Boston Bruins | TD Garden | 41 | 17,565 | 720,165 | 100.0% |
| San Jose Sharks | SAP Center at San Jose | 41 | 17,508 | 717,833 | 99.7% |
| Nashville Predators | Bridgestone Arena | 41 | 17,159 | 703,555 | 100.3% |
| Ottawa Senators | Canadian Tire Centre | 41 | 16,744 | 686,534 | 87.4% |
| Anaheim Ducks | Honda Center | 41 | 15,942 | 653,632 | 92.8% |
| Columbus Blue Jackets | Nationwide Arena | 41 | 15,857 | 650,157 | 87.5% |
| Winnipeg Jets | MTS Centre | 41 | 15,731 | 645,004 | 107.5% |
| Colorado Avalanche | Pepsi Center | 41 | 14,835 | 608,252 | 82.4% |
| Florida Panthers | BB&T Center | 41 | 14,620 | 599,447 | 85.8% |
| New Jersey Devils | Prudential Center | 41 | 14,567 | 597,261 | 88.2% |
| New York Islanders | Barclays Center | 41 | 13,101 | 537,149 | 82.9% |
| Arizona Coyotes | Gila River Arena | 41 | 13,094 | 536,878 | 76.5% |
| Carolina Hurricanes | PNC Arena | 41 | 11,776 | 482,829 | 63.0% |
| Total | | 1,227 | 18,117 | 21,525,777 | |
Notes:
2015–16 attendance statistics
.jpg)
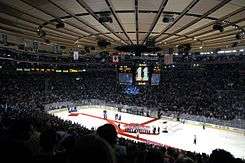
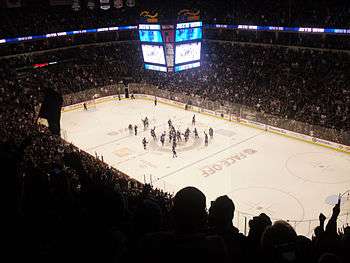
Barclays Center
_PLAYERS_(4314238200).jpg)
Rexall Place

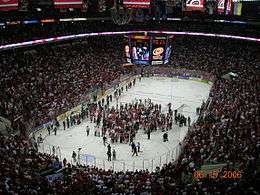
Joe Louis Arena
.jpg)
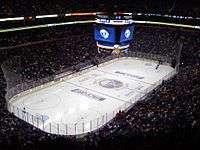
SAP Center at San Jose
| Team | Arena | Home Games | Average Attendance | Total Attendance | Capacity Percentage |
|---|
| Chicago Blackhawks | United Center | 41 | 22,859 | 896,240 | 110.9% [4] |
| Montreal Canadiens | Bell Centre | 41 | 22,288 | 872,808 | 100.1% |
| Detroit Red Wings | Joe Louis Arena | 41 | 20,027 | 821,107 | 100.0% |
| Philadelphia Flyers | Wells Fargo Center | 41 | 19,228 | 788,319 | 98.4% |
| Toronto Maple Leafs | Air Canada Centre | 41 | 19,158 | 785,485 | 101.8% |
| Calgary Flames | Scotiabank Saddledome | 41 | 19,145 | 784,974 | 99.3% |
| Tampa Bay Lightning | Amalie Arena | 41 | 19,092 | 782,772 | 100.0% |
| Minnesota Wild | Xcel Energy Center | 40 | 19,062 | 762,481 | 106.1% |
| Buffalo Sabres | First Niagara Center | 41 | 18,590 | 762,223 | 97.5% |
| Pittsburgh Penguins | Consol Energy Center | 41 | 18,550 | 760,584 | 100.9% |
| Washington Capitals | Verizon Center | 41 | 18,510 | 758,944 | 100.0% |
| St. Louis Blues | Scottrade Center | 41 | 18,450 | 756,483 | 96.3% |
| Vancouver Canucks | Rogers Arena | 41 | 18,431 | 755,677 | 97.5% |
| Dallas Stars | American Airlines Center | 41 | 18,376 | 753,452 | 99.2% |
| Los Angeles Kings | Staples Center | 41 | 18,274 | 749,234 | 100.2% |
| Ottawa Senators | Canadian Tire Centre | 41 | 18,084 | 741,472 | 94.4% |
| New York Rangers | Madison Square Garden | 41 | 18,006 | 738,246 | 100.0% |
| Boston Bruins | TD Garden | 40 | 17,565 | 702,600 | 100.0% |
| Nashville Predators | Bridgestone Arena | 41 | 16,971 | 695,828 | 99.2% |
| Edmonton Oilers | Rexall Place | 41 | 16,841 | 690,499 | 100.0% |
| San Jose Sharks | SAP Center at San Jose | 41 | 16,746 | 686,623 | 95.4% |
| Anaheim Ducks | Honda Center | 41 | 16,336 | 669,805 | 95.1% |
| Colorado Avalanche | Pepsi Center | 40 | 16,206 | 648,232 | 90.0% |
| Florida Panthers | BB&T Center | 41 | 15,384 | 630,746 | 90.3% |
| Winnipeg Jets | MTS Centre | 41 | 15,294 | 627,054 | 101.9% |
| New Jersey Devils | Prudential Center | 41 | 15,073 | 618,029 | 91.3% |
| Columbus Blue Jackets | Nationwide Arena | 41 | 14,665 | 601,293 | 80.8% |
| New York Islanders | Barclays Center | 41 | 13,626 | 558,705 | 86.2% |
| Arizona Coyotes | Gila River Arena | 41 | 13,433 | 550,763 | 78.4% |
| Carolina Hurricanes | PNC Arena | 41 | 10,102 | 500,363 | 65.6% |
| Total | | 1,227 | 17,482 | 21,451,041 | |
Notes:
2014–15 attendance statistics
Gila River Arena
Honda Center

Prudential Center

Rogers Arena
| Team | Arena | Home Games | Average Attendance | Total Attendance | Capacity Percentage |
|---|
| Chicago Blackhawks | United Center | 41 | 21,769 | 892,532 | 110.4% [5] |
| Montreal Canadiens | Bell Centre | 41 | 21,286 | 872,752 | 100.1% |
| Detroit Red Wings | Joe Louis Arena | 41 | 20,027 | 821,107 | 100.0% |
| Philadelphia Flyers | Wells Fargo Center | 41 | 19,270 | 790,107 | 98.6% |
| Calgary Flames | Scotiabank Saddledome | 41 | 19,097 | 782,977 | 99.0% |
| Toronto Maple Leafs | Air Canada Centre | 41 | 19,062 | 781,576 | 101.3% |
| Minnesota Wild | Xcel Energy Center | 41 | 19,023 | 779,944 | 106.0% |
| Tampa Bay Lightning | Amalie Arena | 41 | 18,823 | 771,761 | 98.0% |
| Vancouver Canucks | Rogers Arena | 41 | 18,710 | 767,149 | 98.9% |
| Pittsburgh Penguins | Consol Energy Center | 41 | 18,617 | 763,319 | 101.3% |
| Washington Capitals | Verizon Center | 40 | 18,506 | 740,240 | 100.0%[6] |
| Buffalo Sabres | First Niagara Center | 41 | 18,580 | 761,809 | 97.4% |
| St. Louis Blues | Scottrade Center | 41 | 18,545 | 760,349 | 96.8% |
| Los Angeles Kings | Staples Center | 41 | 18,265 | 748,893 | 100.2% |
| Ottawa Senators | Canadian Tire Centre | 41 | 18,246 | 748,112 | 95.3% |
| New York Rangers | Madison Square Garden | 41 | 18,006 | 738,246 | 100.0% |
| Boston Bruins | TD Garden | 41 | 17,565 | 720,165 | 100.0% |
| San Jose Sharks | SAP Center at San Jose | 40 | 17,420 | 696,807 | 99.6%[6] |
| Dallas Stars | American Airlines Center | 41 | 17,350 | 711,359 | 93.6% |
| Anaheim Ducks | Honda Center | 41 | 16,874 | 691,835 | 98.3% |
| Nashville Predators | Bridgestone Arena | 41 | 16,854 | 691,028 | 98.5% |
| Edmonton Oilers | Rexall Place | 41 | 16,839 | 690,399 | 100.0% |
| Colorado Avalanche | Pepsi Center | 41 | 16,176 | 663,247 | 89.8% |
| Columbus Blue Jackets | Nationwide Arena | 41 | 15,511 | 635,973 | 85.5% |
| New York Islanders | Nassau Veterans Memorial Coliseum | 41 | 15,334 | 628,729 | 94.8% |
| New Jersey Devils | Prudential Center | 41 | 15,189 | 622,783 | 86.2% |
| Winnipeg Jets | MTS Centre | 41 | 15,037 | 616,556 | 100.2% |
| Arizona Coyotes | Gila River Arena | 41 | 13,345 | 547,149 | 77.9% |
| Carolina Hurricanes | PNC Arena | 41 | 12,594 | 516,375 | 67.4% |
| Florida Panthers | BB&T Center | 41 | 11,265 | 461,877 | 66.1% |
| Total | | 1,228 | 17,439 | 21,415,155 | |
Notes:
2013–14 attendance statistics
Staples Center
Madison Square Garden
PNC Arena

BB&T Center
| Team | Arena | Home Games | Average Attendance | Total Attendance | Capacity Percentage |
|---|
| Chicago Blackhawks | United Center | 41 | 22,623 | 927,545 | 117.6% [7] |
| Detroit Red Wings | Joe Louis Arena | 41 | 22,149 | 908,131 | 110.4% |
| Montreal Canadiens | Bell Centre | 41 | 21,273 | 872,193 | 100.0% |
| Philadelphia Flyers | Wells Fargo Center | 41 | 19,839 | 813,411 | 101.5% |
| Vancouver Canucks | Rogers Arena | 41 | 19,770 | 810,594 | 107.2% |
| Toronto Maple Leafs | Air Canada Centre | 41 | 19,446 | 797,310 | 103.3% |
| Calgary Flames | Scotiabank Saddledome | 41 | 19,302 | 791,389 | 100.1% |
| Los Angeles Kings | Staples Center | 41 | 19,017 | 779,734 | 107.6% |
| Pittsburgh Penguins | Consol Energy Center | 41 | 18,618 | 763,344 | 101.3% |
| Tampa Bay Lightning | Tampa Bay Times Forum | 41 | 18,612 | 763,096 | 96.9% |
| Buffalo Sabres | First Niagara Center | 41 | 18,579 | 761,767 | 97.4% |
| Minnesota Wild | Xcel Energy Center | 41 | 18,505 | 758,729 | 103.1% |
| Ottawa Senators | Canadian Tire Centre | 41 | 18,108 | 742,468 | 94.5% |
| Washington Capitals | Verizon Center | 41 | 18,054 | 740,240 | 97.6% |
| New York Rangers | Madison Square Garden | 41 | 18,006 | 738,246 | 100.0% |
| Boston Bruins | TD Garden | 41 | 17,565 | 720,165 | 100.0% |
| San Jose Sharks | SAP Center at San Jose | 41 | 17,133 | 702,480 | 97.6% |
| St. Louis Blues | Scottrade Center | 41 | 17,025 | 698,059 | 88.9% |
| Edmonton Oilers | Rexall Place | 41 | 16,828 | 689,949 | 99.9% |
| Nashville Predators | Bridgestone Arena | 41 | 16,600 | 680,619 | 97.0% |
| Anaheim Ducks | Honda Center | 41 | 16,469 | 675,248 | 95.9% |
| Colorado Avalanche | Pepsi Center | 41 | 16,295 | 668,133 | 90.5% |
| Carolina Hurricanes | PNC Arena | 41 | 15,483 | 634,832 | 82.9% |
| New Jersey Devils | Prudential Center | 41 | 15,257 | 625,570 | 88.7% |
| Winnipeg Jets | MTS Centre | 41 | 15,004 | 615,164 | 100.0% |
| New York Islanders | Nassau Veterans Memorial Coliseum | 41 | 14,740 | 604,362 | 93.4% |
| Columbus Blue Jackets | Nationwide Arena | 41 | 14,698 | 602,619 | 81.0% |
| Dallas Stars | American Airlines Center | 41 | 14,658 | 601,008 | 79.1% |
| Florida Panthers | BB&T Center | 41 | 14,177 | 581,286 | 83.2% |
| Phoenix Coyotes | Jobing.com Arena | 41 | 13,775 | 564,798 | 80.4% |
| Total | | 1,230 | 17,587 | 21,632,479 | |
Notes:
2012–13 attendance statistics
First Niagara Center
Tampa Bay Times Forum
MTS Centre
American Airlines Center
| Team | Arena | Home Games | Average Attendance | Total Attendance | Capacity Percentage |
|---|
| Chicago Blackhawks | United Center | 24 | 21,755 | 522,619 | 110.4% [8] |
| Montreal Canadiens | Bell Centre | 24 | 21,273 | 510,552 | 100.0% |
| Detroit Red Wings | Joe Louis Arena | 24 | 20,066 | 481,584 | 100.0% |
| Philadelphia Flyers | Wells Fargo Center | 24 | 19,786 | 474,878 | 101.3% |
| Toronto Maple Leafs | Air Canada Centre | 24 | 19,426 | 466,224 | 103.2% |
| Ottawa Senators | Scotiabank Place | 24 | 19,408 | 465,801 | 101.3% |
| Calgary Flames | Scotiabank Saddledome | 24 | 19,289 | 462,936 | 100.0% |
| Tampa Bay Lightning | Tampa Bay Times Forum | 24 | 19,055 | 457,337 | 99.2% |
| Buffalo Sabres | First Niagara Center | 24 | 18,970 | 455,290 | 99.5% |
| Vancouver Canucks | Rogers Arena | 24 | 18,947 | 454,740 | 100.2% |
| Minnesota Wild | Xcel Energy Center | 24 | 18,794 | 451,075 | 104.7% |
| Pittsburgh Penguins | Consol Energy Center | 24 | 18,648 | 447,560 | 101.4% |
| Los Angeles Kings | Staples Center | 24 | 18,178 | 436,295 | 100.3% |
| Washington Capitals | Verizon Center | 24 | 17,734 | 425,638 | 95.8% |
| Boston Bruins | TD Garden | 24 | 17,565 | 421,560 | 100.0% |
| San Jose Sharks | HP Pavilion at San Jose | 24 | 17,561 | 421,472 | 100.0% |
| Carolina Hurricanes | PNC Arena | 24 | 17,558 | 421,401 | 94.0% |
| St. Louis Blues | Scottrade Center | 24 | 17,263 | 414,328 | 90.1% |
| New York Rangers | Madison Square Garden | 24 | 17,200 | 412,800 | 100.0% |
| New Jersey Devils | Prudential Center | 24 | 17,114 | 410,739 | 97.1% |
| Dallas Stars | American Airlines Center | 24 | 17,063 | 409,521 | 92.1% |
| Florida Panthers | BankAtlantic Center | 24 | 16,991 | 407,806 | 99.7% |
| Nashville Predators | Bridgestone Arena | 24 | 16,974 | 407,386 | 99.2% |
| Edmonton Oilers | Rexall Place | 24 | 16,839 | 404,136 | 100.0% |
| Anaheim Ducks | Honda Center | 24 | 15,887 | 381,308 | 92.5% |
| Colorado Avalanche | Pepsi Center | 24 | 15,444 | 370,677 | 85.8% |
| Winnipeg Jets | MTS Centre | 24 | 15,004 | 360,096 | 100.0% |
| Columbus Blue Jackets | Nationwide Arena | 24 | 14,564 | 349,558 | 80.3% |
| Phoenix Coyotes | Jobing.com Arena | 24 | 13,923 | 334,165 | 81.3% |
| New York Islanders | Nassau Veterans Memorial Coliseum | 24 | 13,306 | 319,362 | 82.3% |
| Total | | 720 | 17,721 | 12,758,849 | |
2011–12 attendance statistics
Scotiabank Place

United Center
Pepsi Center
Verizon Center
| Team | Arena | Home Games | Average Attendance | Total Attendance | Capacity Percentage |
|---|
| Chicago Blackhawks | United Center | 41 | 21,533 | 882,874 | 109.2% [9] |
| Montreal Canadiens | Bell Centre | 41 | 21,273 | 872,193 | 100.0% |
| Philadelphia Flyers | Wells Fargo Center | 40 | 19,770 | 790,787 | 101.2% |
| Detroit Red Wings | Joe Louis Arena | 41 | 20,066 | 822,706 | 100.0% |
| Toronto Maple Leafs | Air Canada Centre | 41 | 19,505 | 799,686 | 103.6% |
| Ottawa Senators | Scotiabank Place | 41 | 19,357 | 793,612 | 101.1% |
| Calgary Flames | Scotiabank Saddledome | 41 | 19,289 | 790,849 | 100.0% |
| Vancouver Canucks | Rogers Arena | 41 | 18,884 | 774,250 | 100.1% |
| St. Louis Blues | Scottrade Center | 41 | 18,810 | 771,207 | 98.2% |
| Buffalo Sabres | First Niagara Center | 40 | 18,680 | 747,209 | 99.9% |
| Pittsburgh Penguins | Consol Energy Center | 41 | 18,569 | 761,224 | 101.0% |
| Washington Capitals | Verizon Center | 41 | 18,506 | 758,746 | 100.0% |
| Tampa Bay Lightning | Tampa Bay Times Forum | 41 | 18,468 | 757,192 | 96.2% |
| New York Rangers | Madison Square Garden | 41 | 18,191 | 745,852 | 99.9% |
| Los Angeles Kings | Staples Center | 39 | 18,109 | 706,236 | 99.9% |
| Minnesota Wild | Xcel Energy Center | 41 | 17,772 | 728,683 | 98.4% |
| Boston Bruins | TD Garden | 41 | 17,565 | 720,165 | 100.0% |
| San Jose Sharks | HP Pavilion at San Jose | 41 | 17,562 | 720,042 | 100.0% |
| Edmonton Oilers | Rexall Place | 41 | 16,839 | 690,399 | 100.0% |
| Nashville Predators | Bridgestone Arena | 41 | 16,691 | 684,324 | 97.5% |
| Florida Panthers | BankAtlantic Center | 41 | 16,628 | 681,763 | 86.4% |
| Carolina Hurricanes | PNC Arena | 41 | 16,043 | 657,747 | 85.9% |
| Colorado Avalanche | Pepsi Center | 41 | 15,499 | 635,440 | 86.1% |
| New Jersey Devils | Prudential Center | 41 | 15,397 | 631,258 | 87.4% |
| Winnipeg Jets | MTS Centre | 41 | 15,004 | 615,164 | 100.0% |
| Anaheim Ducks | Honda Center | 40 | 14,784 | 591,371 | 86.1% |
| Columbus Blue Jackets | Nationwide Arena | 41 | 14,660 | 601,061 | 80.1% |
| Dallas Stars | American Airlines Center | 41 | 14,227 | 583,306 | 76.8% |
| New York Islanders | Nassau Veterans Memorial Coliseum | 41 | 13,191 | 540,838 | 81.3% |
| Phoenix Coyotes | Jobing.com Arena | 41 | 12,421 | 509,241 | 72.3% |
| Total | | 1,225 | 17,441 | 21,365,425 | |
Notes:
2010–11 attendance statistics

Xcel Energy Center
Consol Energy Center
Wells Fargo Center

Philips Arena
| Team | Arena | Home Games | Average Attendance | Total Attendance | Capacity Percentage |
|---|
| Chicago Blackhawks | United Center | 41 | 21,423 | 878,356 | 108.7% [10] |
| Montreal Canadiens | Bell Centre | 41 | 21,273 | 872,193 | 100.0% |
| Philadelphia Flyers | Wells Fargo Center | 41 | 19,715 | 808,328 | 101.1% |
| Detroit Red Wings | Joe Louis Arena | 41 | 19,680 | 806,892 | 98.1% |
| Toronto Maple Leafs | Air Canada Centre | 41 | 19,354 | 793,522 | 102.9% |
| Calgary Flames | Scotiabank Saddledome | 40 | 19,289 | 771,560 | 100.0% |
| St. Louis Blues | Scottrade Center | 41 | 19,150 | 785,150 | 100.0% |
| Vancouver Canucks | Rogers Arena | 41 | 18,860 | 773,260 | 100.3% |
| Buffalo Sabres | HSBC Arena | 41 | 18,452 | 756,568 | 98.7% |
| Washington Capitals | Verizon Center | 41 | 18,397 | 754,309 | 100.0% |
| Ottawa Senators | Scotiabank Place | 41 | 18,378 | 753,525 | 99.3% |
| Pittsburgh Penguins | Consol Energy Center | 40 | 18,240 | 729,628 | 100.9% |
| New York Rangers | Madison Square Garden | 41 | 18,108 | 742,432 | 99.5% |
| Los Angeles Kings | Staples Center | 41 | 18,083 | 741,404 | 99.8% |
| Minnesota Wild | Xcel Energy Center | 40 | 18,012 | 720,508 | 99.7% |
| Boston Bruins | TD Garden | 40 | 17,565 | 702,600 | 100.0% |
| San Jose Sharks | HP Pavilion at San Jose | 40 | 17,562 | 702,480 | 100.4% |
| Tampa Bay Lightning | St. Pete Times Forum | 41 | 17,268 | 708,022 | 87.4% |
| Edmonton Oilers | Rexall Place | 41 | 16,839 | 690,399 | 100.0% |
| Carolina Hurricanes | RBC Center | 40 | 16,415 | 656,611 | 87.6% |
| Nashville Predators | Bridgestone Arena | 41 | 16,142 | 661,861 | 94.3% |
| Florida Panthers | BankAtlantic Center | 41 | 15,685 | 643,116 | 81.5% |
| Dallas Stars | American Airlines Center | 41 | 15,073 | 617,997 | 81.3% |
| Colorado Avalanche | Pepsi Center | 41 | 14,820 | 607,650 | 82.3% |
| New Jersey Devils | Prudential Center | 41 | 14,775 | 605,803 | 83.8% |
| Anaheim Ducks | Honda Center | 41 | 14,738 | 604,283 | 85.8% |
| Columbus Blue Jackets | Nationwide Arena | 40 | 13,658 | 546,350 | 75.3% |
| Atlanta Thrashers | Philips Arena | 41 | 13,469 | 552,230 | 72.6% |
| Phoenix Coyotes | Jobing.com Arena | 40 | 12,188 | 487,543 | 71.2% |
| New York Islanders | Nassau Veterans Memorial Coliseum | 41 | 11,059 | 453,456 | 67.9% |
| Total | | 1,222 | 17,126 | 20,928,036 | |
Notes:
- Totals do not include six regular-season opening games played in Europe, and two outdoor regular season games.
- The Carolina Hurricanes played the Minnesota Wild at Hartwall Areena in Helsinki, Finland.
- The Columbus Blue Jackets played the San Jose Sharks at the Ericsson Globe in Stockholm, Sweden
- The Boston Bruins played the Phoenix Coyotes at O2 Arena in Prague, Czech Republic.
- The Washington Capitals played the Pittsburgh Penguins outdoors in the Winter Classic at Heinz Field in Pittsburgh, Pennsylvania.
- The Montreal Canadiens played the Calgary Flames outdoors in the Heritage Classic at McMahon Stadium in Calgary, Alberta.
- As of October 2010, Calgary's Pengrowth Saddledome was renamed Scotiabank Saddledome.[11]
- As of August 2011, Buffalo's HSBC Arena was renamed First Niagara Center.[12]
- Following the 2011 season, the Atlanta Thrashers relocated and became the current version of the Winnipeg Jets.
- As of March 15, 2012, the Carolina Hurricanes venue, RBC Center, has been renamed PNC Arena.
- As of September 3, 2014 the Tampa Bay Lightning venue Tampa Bay Times Forum has been renamed Amalie Arena.
- Totals do not include two regular-season opening games played in Europe. The Detroit Red Wings played the St.Louis Blues at the Ericsson Globe in Stockholm, Sweden, and the Chicago Blackhawks played the Florida Panthers at Hartwall Areena in Helsinki, Finland.
- The Pittsburgh Penguins began play in their new arena (Consol Energy Center) on Wednesday, September 22, 2010. With a larger capacity, more luxury seating, and better amenities than their former home Mellon Arena, the Penguins are expected to have a larger average and overall attendance record in the 2010-11 season.[13]
- As of July 6, 2010, Vancouver's GM Place was renamed Rogers Arena.[14]