Lazi, Siquijor
| Lazi | ||
|---|---|---|
| Municipality | ||
| Municipality of Lazi | ||
 Lazi municipal hall | ||
| ||
 Map of Siquijor with Lazi highlighted | ||
.svg.png) Lazi Location within the Philippines | ||
| Coordinates: 9°08′N 123°37′E / 9.13°N 123.62°ECoordinates: 9°08′N 123°37′E / 9.13°N 123.62°E | ||
| Country |
| |
| Region | Central Visayas (Region VII) | |
| Province | Siquijor | |
| District | Lone district of Siquijor | |
| Founded | 1857 | |
| Barangays | 18 (see Barangays) | |
| Government [1] | ||
| • Type | Sangguniang Bayan | |
| • Mayor | James Monte | |
| • Vice Mayor | Earl Aljas | |
| • Congressman | Ramon Vicente Rocamora | |
| • Electorate | 14,279 voters (2016) | |
| Area [2] | ||
| • Total | 70.64 km2 (27.27 sq mi) | |
| Population (2015 census)[3] | ||
| • Total | 20,490 | |
| • Density | 290/km2 (750/sq mi) | |
| Time zone | UTC+8 (PST) | |
| ZIP code | 6228 | |
| PSGC | 076103000 | |
| IDD : area code | +63 (0)35 | |
| Climate type | Tropical monsoon climate | |
| Income class | 4th municipal income class | |
| Revenue (₱) | 66,417,923.30 (2016) | |
| Native languages |
Cebuano Tagalog | |

Lazi, officially the Municipality of Lazi, is a 4th class municipality in the province of Siquijor, Philippines. According to the 2015 census, it has a population of 20,490 people.[3]
Lazi church is currently in the tentative list for UNESCO World Heritage Sites under the Baroque Churches of the Philippines (Extension). A proposal has been suggested by scholars to make a separate UNESCO inclusion for "Old Centre of Lazi which includes the Lazi Church".
Barangays
Lazi comprises 18 barangays:
| PSGC | Barangay | Population | ±% p.a. | |||
|---|---|---|---|---|---|---|
| 2015[3] | 2010[4] | |||||
| 076103001 | Campalanas | 9.7% | 1,979 | 1,873 | 1.05% | |
| 076103002 | Cangclaran | 2.6% | 539 | 533 | 0.21% | |
| 076103003 | Cangomantong | 5.3% | 1,088 | 924 | 3.16% | |
| 076103004 | Capalasanan | 5.6% | 1,145 | 1,214 | −1.11% | |
| 076103005 | Catamboan (Poblacion) | 8.0% | 1,633 | 1,617 | 0.19% | |
| 076103006 | Gabayan | 9.6% | 1,970 | 1,934 | 0.35% | |
| 076103007 | Kimba | 3.5% | 725 | 657 | 1.89% | |
| 076103008 | Kinamandagan | 4.8% | 992 | 922 | 1.40% | |
| 076103009 | Lower Cabangcalan | 4.6% | 952 | 866 | 1.82% | |
| 076103010 | Nagerong | 6.6% | 1,346 | 1,313 | 0.47% | |
| 076103011 | Po‑o | 3.4% | 704 | 711 | −0.19% | |
| 076103012 | Simacolong | 8.7% | 1,777 | 1,801 | −0.26% | |
| 076103013 | Tagmanocan | 4.5% | 927 | 853 | 1.60% | |
| 076103014 | Talayong | 3.1% | 634 | 608 | 0.80% | |
| 076103015 | Tigbawan (Poblacion) | 7.8% | 1,605 | 1,696 | −1.04% | |
| 076103016 | Tignao | 4.5% | 914 | 887 | 0.57% | |
| 076103017 | Upper Cabangcalan | 3.1% | 631 | 658 | −0.79% | |
| 076103018 | Ytaya | 4.5% | 929 | 957 | −0.56% | |
| Total | 20,490 | 20,024 | 0.44% | |||
 San Isidro Labrador Convent
 The century-old Enchanted Balete Tree
Demographics
| Population of Lazi | |||||||||||||||||||||||||||||||||||||||||||||||||
|---|---|---|---|---|---|---|---|---|---|---|---|---|---|---|---|---|---|---|---|---|---|---|---|---|---|---|---|---|---|---|---|---|---|---|---|---|---|---|---|---|---|---|---|---|---|---|---|---|---|
|
| ||||||||||||||||||||||||||||||||||||||||||||||||
| Source: Philippine Statistics Authority[3][4][5] | |||||||||||||||||||||||||||||||||||||||||||||||||
 The wooden Gabaldon school
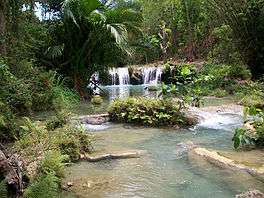 Cambugahay Falls
References
- ↑ "Municipality". Quezon City, Philippines: Department of the Interior and Local Government. Retrieved 31 May 2013.
- ↑ "Province: Siquijor". PSGC Interactive. Quezon City, Philippines: Philippine Statistics Authority. Retrieved 12 November 2016.
- 1 2 3 4 Census of Population (2015). "Region VII (Central Visayas)". Total Population by Province, City, Municipality and Barangay. PSA. Retrieved 20 June 2016.
- 1 2 Census of Population and Housing (2010). "Region VII (Central Visayas)". Total Population by Province, City, Municipality and Barangay. NSO. Retrieved 29 June 2016.
- ↑ Censuses of Population (1903–2007). "Region VII (Central Visayas)". Table 1. Population Enumerated in Various Censuses by Province/Highly Urbanized City: 1903 to 2007. NSO.
External links

Siquijor (capital) | |
| Municipalities | |
This article is issued from
Wikipedia.
The text is licensed under Creative Commons - Attribution - Sharealike.
Additional terms may apply for the media files.