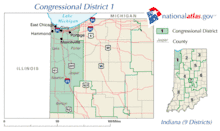
Indiana's 1st congressional district
| Indiana's 1st congressional district | |
|---|---|
.tif.png) Indiana's 1st congressional district - since January 3, 2013. | |
| Current Representative | Pete Visclosky (D–Merrillville) |
| Area | 2,209.37 sq mi (5,722.2 km2) |
| Distribution |
|
| Population (2000) | 675,562 |
| Median income | 44,087 |
| Ethnicity |
|
| Cook PVI | D+8[1] |
Indiana's 1st congressional district is a congressional district in the U.S. state of Indiana. The district is based in Gary and its surrounding suburbs and exurbs. It consists of all of Lake and Porter counties and most of western LaPorte County in the northwestern part of the state. Redistricting passed by the Indiana General Assembly in 2011 shifted the district's boundaries, effective January 2013, to include all of Lake and Porter counties and the western and northwestern townships of LaPorte County, while moving Benton, Jasper and Newton counties out of the district.
The district is currently represented by Democrat Pete Visclosky.
The district's character is very different from the rest of Indiana. It includes almost all of the Indiana side of the Chicago metropolitan area. While Porter and LaPorte counties are swing counties, Lake County is heavily Democratic. Lake County contains more than 70 percent of the district's population and has more people than the rest of the district combined, which is enough to make the 1st a relatively safe Democratic seat. The district has not elected a Republican to Congress in 90 years, making it one of the most Democratic districts in the nation. Among Indiana's congressional districts, only the Indianapolis-based 7th District is more Democratic.
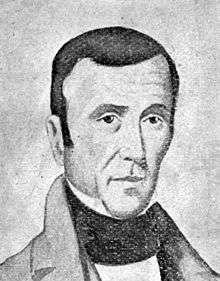
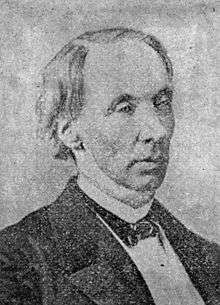
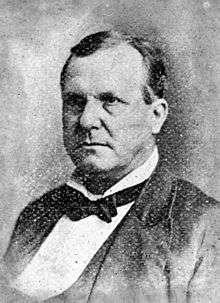
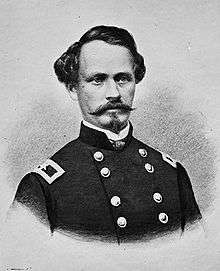
List of representatives
| Representative | Party | Years | Electoral history |
|---|---|---|---|
District created |
March 4, 1823 | ||
 |
Jacksonian Democratic-Republican |
March 4, 1823 – September 8, 1824 |
Elected in 1822. Died. |
| Vacant | September 8, 1824 – December 23, 1824 | ||
|
Jacksonian Democratic-Republican |
December 23, 1824 – March 3, 1825 |
Elected to finish Prince's term. [Data unknown/missing.] |
 |
March 4, 1825 – March 3, 1827 |
[Data unknown/missing.] | |
|
March 4, 1827 – March 3, 1829 |
[Data unknown/missing.] | |
|
March 4, 1829 – March 3, 1837 |
[Data unknown/missing.] | |
| March 4, 1837 – March 3, 1839 | |||
|
March 4, 1839 – March 3, 1843 |
[Data unknown/missing.] | |
 |
March 4, 1843 – March 3, 1847 |
[Data unknown/missing.] | |
|
March 4, 1847 – March 3, 1849 |
[Data unknown/missing.] | |
|
March 4, 1849 – March 3, 1851 |
[Data unknown/missing.] | |
|
March 4, 1851 – March 3, 1853 |
[Data unknown/missing.] | |
|
March 4, 1853 – March 3, 1857 |
[Data unknown/missing.] | |
|
March 4, 1857 – September 7, 1857 |
Died. | |
 |
December 7, 1857 – March 3, 1861 |
[Data unknown/missing.] | |
|
March 4, 1861 – March 3, 1865 |
[Data unknown/missing.] | |
|
March 4, 1865 – March 3, 1875 |
[Data unknown/missing.] | |
 |
March 4, 1875 – March 3, 1879 |
[Data unknown/missing.] | |
 |
March 4, 1879 – March 3, 1883 |
[Data unknown/missing.] | |
|
March 4, 1883 – March 3, 1887 |
[Data unknown/missing.] | |
 |
March 4, 1887 – January 17, 1889 |
Resigned after being elected Governor | |
| Vacant | January 17, 1889 – January 29, 1889 | ||
|
January 29, 1889 – March 3, 1889 |
[Data unknown/missing.] | |
|
March 4, 1889 – March 3, 1893 |
[Data unknown/missing.] | |
|
March 4, 1893 – March 3, 1895 |
[Data unknown/missing.] | |
 |
March 4, 1895 – March 3, 1905 |
Resigned at close of Congress after being elected US Senator | |
| Vacant | March 4, 1905 – May 16, 1905 | ||
|
May 16, 1905 – March 3, 1909 |
[Data unknown/missing.] | |
|
March 4, 1909 – March 3, 1913 |
[Data unknown/missing.] | |
 |
March 4, 1913 – March 3, 1917 |
[Data unknown/missing.] | |
|
March 4, 1917 – March 3, 1919 |
[Data unknown/missing.] | |
|
March 4, 1919 – March 3, 1923 |
[Data unknown/missing.] | |
|
March 4, 1923 – March 3, 1925 |
[Data unknown/missing.] | |
|
March 4, 1925 – March 3, 1931 |
[Data unknown/missing.] | |
|
March 4, 1931 – March 3, 1933 |
Redistricted to the 8th district. | |
 |
March 4, 1933 – January 3, 1943 |
Not re-nominated by the Democratic Party. | |
.jpg) |
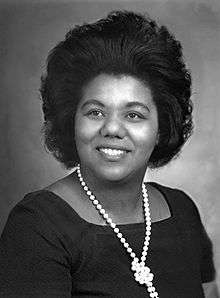
January 3, 1943 – January 3, 1977 |
Defeated in the Democratic primary. | |
 |
January 3, 1977 – September 7, 1982 |
Died. | |
| Vacant | September 7, 1982 – November 2, 1982 | ||
 |
November 2, 1982 – January 3, 1985 |
Defeated in the Democratic primary. | |
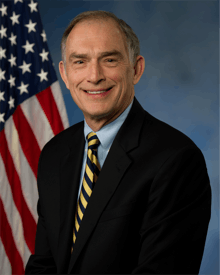 |
January 3, 1985 – Present |
First elected in 1984. | |
Historical Election Results
| Party | Candidate | Votes | % | ± | |
|---|---|---|---|---|---|
| Democratic | Ratliff Boon | 4,281 | 42.1 | ||
| Independent | Jacob Call | 3,222 | 31.7 | ||
| National Republican | Thomas H. Blake | 2,661 | 26.2 | ||
| Party | Candidate | Votes | % | ± | |
|---|---|---|---|---|---|
| National Republican | Thomas H. Blake | 5,223 | 43.0 | ||
| Democratic | Ratliff Boon | 5,202 | 42.8 | ||
| Independent | Lawrence S. Shuler | 1,723 | 14.2 | ||
| Party | Candidate | Votes | % | ± | |
|---|---|---|---|---|---|
| Democratic | Ratliff Boon | 7,272 | 52.2 | ||
| National Republican | Thomas H. Blake | 6,671 | 47.8 | ||
| Party | Candidate | Votes | % | ± | |
|---|---|---|---|---|---|
| Democratic | Ratliff Boon | 11,280 | 50.9 | ||
| Democratic | John Law | 10,868 | 49.1 | ||
| Party | Candidate | Votes | % | ± | |
|---|---|---|---|---|---|
| Democratic | Ratliff Boon | 3,973 | 50.6 | ||
| Independent | Dennis Pennington | 1,120 | 14.3 | ||
| Independent | Robert M. Evans | 1,069 | 13.6 | ||
| Independent | James R. E. Goodlet | 788 | 10.0 | ||
| Independent | Seth M. Levenworth | 611 | 7.8 | ||
| Party | Candidate | Votes | % | ± | |
|---|---|---|---|---|---|
| Democratic | Ratliff Boon | 4,028 | 51.4 | ||
| Whig | John G. Clendenin | 3,815 | 48.6 | ||
| Party | Candidate | Votes | % | ± | |
|---|---|---|---|---|---|
| Democratic | Ratliff Boon | 4,534 | 50.4 | ||
| Whig | John Pitcher | 4,467 | 49.6 | ||
| Party | Candidate | Votes | % | ± | |
|---|---|---|---|---|---|
| Whig | George H. Proffit | 6,008 | 53.5 | ||
| Democratic | Robert Dale Owen | 5,229 | 46.5 | ||
| Party | Candidate | Votes | % | ± | |
|---|---|---|---|---|---|
| Whig | Joseph Trumbull | 5,142 | 57.1 | ||
| Democratic | Thomas Seymour | 3,867 | 42.9 | ||
| Party | Candidate | Votes | % | ± | |
|---|---|---|---|---|---|
| Democratic | Robert Dale Owen | 6,679 | 52.2 | ||
| Whig | John W. Payne | 6,127 | 47.8 | ||
| Party | Candidate | Votes | % | ± | |
|---|---|---|---|---|---|
| Democratic | Robert Dale Owen | 7,336 | 53.7 | ||
| Whig | George P. R. Wilson | 6,331 | 46.3 | ||
| Party | Candidate | Votes | % | ± | |
|---|---|---|---|---|---|
| Whig | Elisha Embree | 7,446 | 51.4 | ||
| Democratic | Robert Dale Owen | 7,054 | 48.7 | ||
| Party | Candidate | Votes | % | ± | |
|---|---|---|---|---|---|
| Democratic | Nathaniel Albertson | 8,271 | 52.1 | ||
| Whig | Elisha Embree | 7,598 | 47.9 | ||
| Party | Candidate | Votes | % | ± | |
|---|---|---|---|---|---|
| Democratic | James Lockhart | 8,173 | 51.0 | ||
| Whig | Lemuel Debruler | 7,855 | 49.0 | ||
| Party | Candidate | Votes | % | ± | |
|---|---|---|---|---|---|
| Democratic | Smith Miller | 9,007 | 59.0 | ||
| Whig | Kea | 9,007 | 51.0 | ||
| Party | Candidate | Votes | % | ± | |
|---|---|---|---|---|---|
| Democratic | Smith Miller | 9,864 | 52.2 | ||
| Know Nothing | Hall | 9,051 | 47.9 | ||
| Party | Candidate | Votes | % | ± | |
|---|---|---|---|---|---|
| Democratic | James Lockhart | 12,747 | 61.5 | ||
| Republican | James C. Veatch | 7,977 | 38.5 | ||
| Party | Candidate | Votes | % | ± | |
|---|---|---|---|---|---|
| Democratic | William E. Niblack | 10,329 | |||
| Republican | Alvin P. Hovey | 8,946 | 46.4 | ||
| Party | Candidate | Votes | % | ± | |
|---|---|---|---|---|---|
| Democratic | John Law | 13,476 | 55.7 | ||
| Republican | Lemuel Debruler | 10,731 | 44.3 | ||
| Party | Candidate | Votes | % | ± | |
|---|---|---|---|---|---|
| Democratic | John Law | 11,963 | 53.1 | ||
| National Union | Johnson | 10,583 | 46.9 | ||
| Party | Candidate | Votes | % | ± | |
|---|---|---|---|---|---|
| Democratic | William E. Niblack | 14,718 | 53.9 | ||
| National Union | Cyrus M. Allen | 112,616 | 46.2 | ||
| Party | Candidate | Votes | % | ± | |
|---|---|---|---|---|---|
| Democratic | William E. Niblack | 17,255 | 52.0 | ||
| Republican | Lemuel Debruler | 15,905 | 48.0 | ||
| Party | Candidate | Votes | % | ± | |
|---|---|---|---|---|---|
| Democratic | William E. Niblack | 18,116 | 52.1 | ||
| Republican | James Veatch | 16,631 | 47.9 | ||
| Party | Candidate | Votes | % | ± | |
|---|---|---|---|---|---|
| Democratic | William E. Niblack | 17,577 | 53.4 | ||
| Republican | Hy C. Goodling | 15,327 | 46.6 | ||
| Party | Candidate | Votes | % | ± | |
|---|---|---|---|---|---|
| Democratic | William E. Niblack | 19,259 | 50.2 | ||
| Republican | Heilman | 19,127 | 49.8 | ||
| Party | Candidate | Votes | % | ± | |
|---|---|---|---|---|---|
| Democratic | Benoni S. Fuller | 12,864 | 50.7 | ||
| Republican | Heilman | 12,527 | 49.3 | ||
| Party | Candidate | Votes | % | ± | |
|---|---|---|---|---|---|
| Democratic | Benoni S. Fuller | 14,727 | 50.6 | ||
| Republican | C. A. Debruler | 13,158 | 45.2 | ||
| Party | Candidate | Votes | % | ± | |
|---|---|---|---|---|---|
| Republican | William Heilman | 13,928 | 48.7 | ||
| Democratic | Thomas E. Garvin | 13,928 | 48.7 | ||
| Greenback | Thomas F. Drebruler | 1,595 | 5.6 | ||
| Party | Candidate | Votes | % | ± | |
|---|---|---|---|---|---|
| Republican | William Heilman | 17,719 | 49.4 | ||
| Democratic | John Kleiner | 17,420 | 48.6 | ||
| Party | Candidate | Votes | % | ± | |
|---|---|---|---|---|---|
| Democratic | John Kleiner | 18,048 | 51.6 | ||
| Republican | William Heilman | 16,399 | 46.9 | ||
| Party | Candidate | Votes | % | ± | |
|---|---|---|---|---|---|
| Democratic | John J. Kleiner | 19,930 | 51.5 | ||
| Republican | William H. Gudgel | 18,493 | 47.8 | ||
| Party | Candidate | Votes | % | ± | |
|---|---|---|---|---|---|
| Republican | Alvin P. Hovey | 18,258 | 49.0 | ||
| Democratic | J. E. McCullough | 16,901 | 45.4 | ||
| Party | Candidate | Votes | % | ± | |
|---|---|---|---|---|---|
| Democratic | William F. Parrett | 20,647 | 49.3 | ||
| Republican | Frank B. Posey | 20,627 | 49.3 | ||
| Party | Candidate | Votes | % | ± | |
|---|---|---|---|---|---|
| Democratic | William F. Parrett | 17,730 | 50.4 | ||
| Republican | James S. Wright | 16,875 | 48.0 | ||
| Party | Candidate | Votes | % | ± | |
|---|---|---|---|---|---|
| Democratic | Arthur H. Taylor | 19,720 | 47.4 | ||
| Republican | A. P. Twineham | 19,266 | 46.3 | ||
| Populist | Moses Smith | 2,110 | 5.1 | ||
| Party | Candidate | Votes | % | ± | |
|---|---|---|---|---|---|
| Republican | James A. Hemenway | 20,535 | 47.8 | ||
| Democratic | Arthur H. Taylor | 18,245 | 42.5 | ||
| Populist | James A. Boyce | 3,820 | 8.9 | ||
| Party | Candidate | Votes | % | ± | |
|---|---|---|---|---|---|
| Republican | James A. Hemenway | 21,807 | 49.6 | ||
| Democratic | Thomas Duncan | 20,856 | 47.4 | ||
| Party | Candidate | Votes | % | ± | |
|---|---|---|---|---|---|
| Republican | James A. Hemenway | 20,383 | 50.7 | ||
| Democratic | Thomas Duncan | 19,337 | 48.1 | ||
| Party | Candidate | Votes | % | ± | |
|---|---|---|---|---|---|
| Republican | James A. Hemenway | 22,262 | 49.7 | ||
| Democratic | Alfred Dale Owen | 22,060 | 49.3 | ||
| Party | Candidate | Votes | % | ± | |
|---|---|---|---|---|---|
| Republican | James A. Hemenway | 21,542 | 52.0 | ||
| Democratic | John W. Spencer | 17,833 | 43.1 | ||
| Party | Candidate | Votes | % | ± | |
|---|---|---|---|---|---|
| Republican | James A. Hemenway | 23,158 | 51.1 | ||
| Democratic | Albert G. Holcomb | 19,399 | 42.8 | ||
| Party | Candidate | Votes | % | ± | |
|---|---|---|---|---|---|
| Republican | James H. Foster | 20c278 | 50.0 | ||
| Democratic | Gusatvus V. Menzies | 18,959 | 46.7 | ||
| Party | Candidate | Votes | % | ± | |
|---|---|---|---|---|---|
| Democratic | John W. Boehne | 23,054 | 48.3 | ||
| Republican | John H. Foster | 22,965 | 48.1 | ||
| Party | Candidate | Votes | % | ± | |
|---|---|---|---|---|---|
| Democratic | John W. Boehne | 22,420 | 52.3 | ||
| Republican | Francis B. Posey | 18,606 | 43.4 | ||
\
| Party | Candidate | Votes | % | ± | |
|---|---|---|---|---|---|
| Democratic | Charles Lieb | 20,014 | 45.7 | ||
| Republican | D.H. Ortmeyer | 13,158 | 30.0 | ||
| Progressive | Humphrey C. Heidt | 6,022 | 13.7 | ||
| Socialist | William H Rainey | 3,737 | 8.5 | ||
| Party | Candidate | Votes | % | ± | |
|---|---|---|---|---|---|
| Democratic | Charles Lieb | 20,488 | 46.6 | ||
| Republican | S. Wallace Cook | 17,661 | 40.1 | ||
| Progressive | U.H Seider | 3,519 | 8.0 | ||
| Party | Candidate | Votes | % | ± | |
|---|---|---|---|---|---|
| Democratic | George F. Denton | 23,278 | 48.1 | ||
| Republican | S. Wallace Cook | 22,955 | 47.4 | ||
| Party | Candidate | Votes | % | ± | |
|---|---|---|---|---|---|
| Republican | Oscar R. Luhring | 20,440 | 52.0 | ||
| Democratic | George K. Denton | 18,837 | 48.0 | ||
| Party | Candidate | Votes | % | ± | |
|---|---|---|---|---|---|
| Republican | Oscar R. Luhring | 44,694 | 51.7 | ||
| Democratic | William E. Wilson | 36,834 | 42.6 | ||
| Party | Candidate | Votes | % | ± | |
|---|---|---|---|---|---|
| Democratic | William . Wilson | 42,797 | 53.6 | ||
| Republican | Oscar . Luhring | 36,835 | 44.9 | ||
| Party | Candidate | Votes | % | ± | |
|---|---|---|---|---|---|
| Republican | Harry E. Rowbottom | 48,203 | 52.1 | ||
| Democratic | William E. Wilson | 44,335 | 47.9 | ||
| Party | Candidate | Votes | % | ± | |
|---|---|---|---|---|---|
| Republican | Harry E. Rowbottom | 37,503 | 52.4 | ||
| Democratic | William E. Wilson | 34,061 | 47.6 | ||
| Party | Candidate | Votes | % | ± | |
|---|---|---|---|---|---|
| Republican | Harry E. Rowbottom | 49,013 | 50.8 | ||
| Democratic | John W. Boehne, Jr. | 47,404 | 49.2 | ||
| Party | Candidate | Votes | % | ± | |
|---|---|---|---|---|---|
| Democratic | John W. Boehne, Jr. | 46,836 | 53.9 | ||
| Republican | Harry E. Rowbottom | 40,015 | 46.1 | ||
| Party | Candidate | Votes | % | ± | |
|---|---|---|---|---|---|
| Democratic | William T. Schulte | 45,473 | 50.0 | ||
| Republican | Oscar A. Ahlgren | 42,575 | 46.8 | ||
| Party | Candidate | Votes | % | ± | |
|---|---|---|---|---|---|
| Democratic | William T. Schulte | 44,983 | 53.5 | ||
| Republican | E. Miles Norton | 38,531 | 45.9 | ||
| Party | Candidate | Votes | % | ± | |
|---|---|---|---|---|---|
| Democratic | William T. Schulte | 68,210 | 66.4 | ||
| Republican | Fred F. Schultx | 24,259 | 33.3 | ||
| Party | Candidate | Votes | % | ± | |
|---|---|---|---|---|---|
| Democratic | William T.Schulte | 56,630 | 54.9 | ||
| Republican | M. Elliott Belshaw | 46,370 | 45.0 | ||
| Party | Candidate | Votes | % | ± | |
|---|---|---|---|---|---|
| Democratic | William T. Schulte | 71,606 | 60.8 | ||
| Republican | Elliot Belshaw | 45,947 | 39.0 | ||
| Party | Candidate | Votes | % | ± | |
|---|---|---|---|---|---|
| Democratic | Ray J. Madden | 44,334 | 53.6 | ||
| Republican | Samuel W. Cullison | 38,450 | 48.5 | ||
| Party | Candidate | Votes | % | ± | |
|---|---|---|---|---|---|
| Democratic | Ray J. Madden | 75,635 | 61.3 | ||
| Republican | Otto G. Fifield | 46,969 | 38.1 | ||
| Party | Candidate | Votes | % | ± | |
|---|---|---|---|---|---|
| Democratic | Ray J. Madden | 51,809 | 51.9 | ||
| Republican | Charles W. Gannon | 46,677 | 48.8 | ||
| Party | Candidate | Votes | % | ± | |
|---|---|---|---|---|---|
| Democratic | Ray J. Madden | 78,898 | 60.7 | ||
| Republican | Theodore L. Sendak | 50,194 | 38.6 | ||
| Party | Candidate | Votes | % | ± | |
|---|---|---|---|---|---|
| Democratic | Ray J. Madden | 62,666 | 52.6 | ||
| Republican | Paul Cyr | 56,063 | 47.0 | ||
| Party | Candidate | Votes | % | ± | |
|---|---|---|---|---|---|
| Democratic | Ray J. Madden | 93,187 | 56.4 | ||
| Republican | Elliot Belshaw | 71,617 | 43.3 | ||
| Party | Candidate | Votes | % | ± | |
|---|---|---|---|---|---|
| Democratic | Ray J. Madden | 81,217 | 61.4 | ||
| Republican | Robert H. More | 50,439 | 38.2 | ||
| Party | Candidate | Votes | % | ± | |
|---|---|---|---|---|---|
| Democratic | Ray J. Madden | 93,658 | 52.6 | ||
| Republican | Donald K. Stimson Jr. | 84,125 | 47.2 | ||
| Party | Candidate | Votes | % | ± | |
|---|---|---|---|---|---|
| Democratic | Ray J. Madden | 95,801 | 66.4 | ||
| Republican | Edward P. Keck | 47,588 | 33.0 | ||
| Party | Candidate | Votes | % | ± | |
|---|---|---|---|---|---|
| Democratic | Ray J. Madden | 136,443 | 64.7 | ||
| Republican | Phillip P. Parker | 73,984 | 35.1 | ||
| Party | Candidate | Votes | % | ± | |
|---|---|---|---|---|---|
| Democratic | Ray J. Madden | 104,212 | 60.5 | ||
| Republican | Harold Moody | 67,230 | 39.0 | ||
| Party | Candidate | Votes | % | ± | |
|---|---|---|---|---|---|
| Democratic | Ray J. Madden | 133,089 | 63.7 | ||
| Republican | Arthur Endres | 75,226 | 36.0 | ||
| Party | Candidate | Votes | % | ± | |
|---|---|---|---|---|---|
| Democratic | Ray J. Madden | 71,040 | 58.3 | ||
| Republican | Albert F. Harrigan | 50,804 | 41.7 | ||
| Party | Candidate | Votes | % | ± | |
|---|---|---|---|---|---|
| Democratic | Ray J. Madden | 90,055 | 56.7 | ||
| Republican | Donalrd E. Taylor | 68,318 | 43.0 | ||
| Party | Candidate | Votes | % | ± | |
|---|---|---|---|---|---|
| Democratic | Ray J. Madden | 73,145 | 65.6 | ||
| Republican | Eugene M. Kirtland | 38,294 | 34.4 | ||
| Party | Candidate | Votes | % | ± | |
|---|---|---|---|---|---|
| Democratic | Ray J. Madden | 95,873 | 56.9 | ||
| Republican | Bruce R. Haller | 72,662 | 43.1 | ||
| Party | Candidate | Votes | % | ± | |
|---|---|---|---|---|---|
| Democratic | Ray J. Madden | 71,759 | 68.6 | ||
| Republican | Joseph D. Harkin | 32,793 | 31.4 | ||
| Party | Candidate | Votes | % | ± | |
|---|---|---|---|---|---|
| Democratic | Adam Benjamin, Jr. | 121,155 | 71.3 | ||
| Republican | Robert J. Billings | 48,756 | 31.7 | ||
| Party | Candidate | Votes | % | ± | |
|---|---|---|---|---|---|
| Democratic | Adam Benjamin, Jr. | 72,367 | 80.2% | ||
| Republican | Robert J. Billings | 17,419 | 19.3 | ||
| U.S. Labor | Christopher Martinson | 384 | 0.4% | ||
| Party | Candidate | Votes | % | ± | |
|---|---|---|---|---|---|
| Democratic | Adam Benjamin, Jr. | 112,016 | 72.0% | ||
| Republican | Joseph Douglas Harkin | 43,537 | 28.0% | ||
Recent Electoral Results
2002
| Party | Candidate | Votes | % | |
|---|---|---|---|---|
| Democratic | Pete Visclosky (Incumbent) | 90,443 | 66.94 | |
| Republican | Mark J. Leyva | 41,909 | 31.02 | |
| Libertarian | Timothy P. Brennan | 2,759 | 2.04 | |
| Total votes | 135,111 | 100.00 | ||
| Turnout | ||||
| Democratic hold | ||||
2004
| Party | Candidate | Votes | % | |
|---|---|---|---|---|
| Democratic | Pete Visclosky (Incumbent) | 178,406 | 68.29 | |
| Republican | Mark J. Leyva | 82,858 | 31.71 | |
| Total votes | 261,264 | 100.00 | ||
| Turnout | ||||
| Democratic hold | ||||
2006
| Party | Candidate | Votes | % | |
|---|---|---|---|---|
| Democratic | Pete Visclosky (Incumbent) | 104,195 | 69.65 | |
| Republican | Mark J. Leyva | 40,146 | 26.83 | |
| Independent | Chuck Barman | 5,266 | 3.52 | |
| Total votes | 149,607 | 100.00 | ||
| Turnout | ||||
| Democratic hold | ||||
2008
| Party | Candidate | Votes | % | |
|---|---|---|---|---|
| Democratic | Pete Visclosky (Incumbent) | 199,954 | 70.90 | |
| Republican | Mark J. Leyva | 76,647 | 27.18 | |
| Libertarian | Jeff Duensing | 5,421 | 1.92 | |
| Total votes | 282,022 | 100.00 | ||
| Turnout | ||||
| Democratic hold | ||||
2010
| Party | Candidate | Votes | % | |
|---|---|---|---|---|
| Democratic | Pete Visclosky (Incumbent) | 99,387 | 58.56 | |
| Republican | Mark J. Leyva | 65,558 | 38.63 | |
| Libertarian | Jon Morris | 4,762 | 2.81 | |
| Total votes | 169,707 | 100.00 | ||
| Turnout | ||||
| Democratic hold | ||||
2012
| Party | Candidate | Votes | % | |
|---|---|---|---|---|
| Democratic | Pete Visclosky (Incumbent) | 187,743 | 67.28 | |
| Republican | Joel Phelps | 91,291 | 32.72 | |
| Total votes | 279,034 | 100.00 | ||
| Turnout | ||||
| Democratic hold | ||||
2014
| Party | Candidate | Votes | % | |
|---|---|---|---|---|
| Democratic | Pete Visclosky (Incumbent) | 86,579 | 60.85 | |
| Republican | Mark Leyva | 51,000 | 35.84 | |
| Libertarian | Donna Dunn | 4,714 | 3.31 | |
| Independent | James Johnson Jr. (Write-in) | 0 | 0.00 | |
| Total votes | 142,293 | 100.00 | ||
| Democratic hold | ||||
2016
| Party | Candidate | Votes | % | |
|---|---|---|---|---|
| Democratic | Pete Visclosky (Incumbent) | 207,514 | 81.51 | |
| Libertarian | Donna Dunn | 47,051 | 18.48 | |
| Independent | John Meyer | 17 | 0.00 | |
| Total votes | 254,583 | 100.00 | ||
| Democratic hold | ||||
Living former Members
As of April 2017, no former members of the U.S. House of Representatives from Indiana's 1st congressional district are alive. The most recent representative to die was Katie Hall (1982–1985) on February 20, 2012.
Historical district boundaries
See also
References
- ↑ "Partisan Voting Index – Districts of the 115th Congress" (PDF). The Cook Political Report. April 7, 2017. Retrieved April 7, 2017.
- ↑ Congressional Quarterly, p. 545
- ↑ Congressional Quarterly, p. 548
- ↑ Congressional Quarterly, p. 551
- ↑ Congressional Quarterly, p. 556
- ↑ Congressional Quarterly, p. 560
- ↑ Congressional Quarterly, p. 564
- ↑ Congressional Quarterly, p. 568
- ↑ Congressional Quarterly, p. 572
- 1 2 Congressional Quarterly
- ↑ Congressional Quarterly, p. 578
- ↑ Congressional Quarterly, p. 582
- ↑ Congressional Quarterly, p. 585
- ↑ Congressional Quarterly, p. 589
- ↑ Congressional Quarterly, p. 593
- ↑ Congressional Quarterly, p. 595
- ↑ Congressional Quarterly, p. 598
- ↑ Congressional Quarterly, p. 601
- ↑ Congressional Quarterly, p. 605
- ↑ Congressional Quarterly, p. 607
- ↑ Congressional Quarterly, p. 610
- ↑ Congressional Quarterly, p. 616
- ↑ Congressional Quarterly, p. 619
- ↑ Congressional Quarterly, p. 623
- ↑ Congressional Quarterly, p. 626
- ↑ Congressional Quarterly, p. 630
- ↑ Congressional Quarterly, p. 634
- ↑ Congressional Quarterly, p. 638
- ↑ Congressional Quarterly, p. 642
- ↑ Congressional Quarterly, p. 646
- ↑ Congressional Quarterly, p. 650
- ↑ Congressional Quarterly, p. 654
- ↑ Congressional Quarterly, p. 658
- ↑ Congressional Quarterly, p. 662
- ↑ Congressional Quarterly, p. 667
- ↑ Congressional Quarterly, p. 672
- ↑ Congressional Quarterly, p. 677
- ↑ Congressional Quarterly, p. 682
- 1 2 Congressional Quarterly, p. 687
- ↑ Congressional Quarterly, p. 690
- ↑ Congressional Quarterly, p. 696
- ↑ Congressional Quarterly, p. 693
- ↑ Congressional Quarterly, p. 702
- ↑ Congressional Quarterly, p. 710
- ↑ Congressional Quarterly, p. 718
- ↑ Congressional Quarterly, p. 723
- ↑ Congressional Quarterly, p. 729
- ↑ Congressional Quarterly, p. 736
- ↑ Congressional Quarterly, p. 741
- ↑ Congressional Quarterly, p. 747
- ↑ Congressional Quarterly, p. 751
- ↑ Congressional Quarterly, p. 756
- ↑ Congressional Quarterly, p. 761
- ↑ Congressional Quarterly, p. 766
- ↑ Congressional Quarterly, p. 771
- ↑ Congressional Quarterly, p. 776
- ↑ Congressional Quarterly, p. 781
- ↑ Congressional Quarterly, p. 786
- ↑ Congressional Quarterly, p. 791
- ↑ Congressional Quarterly, p. 801
- ↑ Congressional Quarterly, p. 806
- ↑ Congressional Quarterly, p. 811
- ↑ Congressional Quarterly, p. 816
- ↑ Congressional Quarterly, p. 821
- ↑ Congressional Quarterly, p. 826
- ↑ Congressional Quarterly, p. 831
- ↑ Congressional Quarterly, p. 836
- ↑ Congressional Quarterly, p. 842
- ↑ Congressional Quarterly, p. 847
- ↑ Congressional Quarterly, p. 852
- ↑ Congressional Quarterly, p. 857
- ↑ Congressional Quarterly, p. 862
- ↑ Congressional Quarterly, p. 867
- ↑ Congressional Quarterly, p. 872
- ↑ Congressional Quarterly, p. 877
- ↑ "STATISTICS OF THE PRESIDENTIAL AND CONGRESSIONAL ELECTION OF NOVEMBER, 2, 1976" (PDF). clerk.house.gov.
- ↑ "STATISTICS OF THE PRESIDENTIALAND CONGRESSIONAL ELECTION OF NOVEMBER, 7, 1978" (PDF). clerk.house.gov.
- ↑ "STATISTICS OF THE PRESIDENTIALAND CONGRESSIONAL ELECTION OF NOVEMBER 4, 1980" (PDF). clerk.house.gov.
- ↑ "Election Results". Indiana Elections Division. November 28, 2012. Retrieved December 30, 2012.
- ↑ "Secretary of State : Election Division: Election Results". in.gov. March 11, 2015. Retrieved September 13, 2017.
- Martis, Kenneth C. (1989). The Historical Atlas of Political Parties in the United States Congress. New York: Macmillan Publishing Company.
- Martis, Kenneth C. (1982). The Historical Atlas of United States Congressional Districts. New York: Macmillan Publishing Company.
- Congressional Biographical Directory of the United States 1774–present
- Congressional Quarterly's Guide to US Elections. Congressional Quarterly Inc. 1975. ISBN 0-87187-072-X.
External links
- Congressman Pete Visclosky, Official U.S. House site