Hohenbocka
| Hohenbocka | ||
|---|---|---|
| ||
 Hohenbocka Location of Hohenbocka within Oberspreewald-Lausitz district 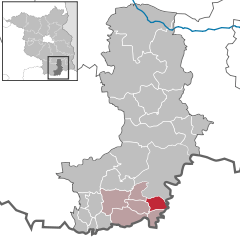  | ||
| Coordinates: 51°25′59″N 14°00′00″E / 51.43306°N 14.00000°ECoordinates: 51°25′59″N 14°00′00″E / 51.43306°N 14.00000°E | ||
| Country | Germany | |
| State | Brandenburg | |
| District | Oberspreewald-Lausitz | |
| Municipal assoc. | Ruhland | |
| Government | ||
| • Mayor | Roland Schmidt (Wählergemeinschaft Hohenbocka) | |
| Area | ||
| • Total | 15.59 km2 (6.02 sq mi) | |
| Elevation | 128 m (420 ft) | |
| Population (2017-12-31)[1] | ||
| • Total | 970 | |
| • Density | 62/km2 (160/sq mi) | |
| Time zone | CET/CEST (UTC+1/+2) | |
| Postal codes | 01945 | |
| Dialling codes | 035756 | |
| Vehicle registration | OSL | |
| Website | www.amt-ruhland.de/amtsgemeinden/hohenbocka/ | |

Hohenbocka (Lower Sorbian Hory Bukow, Polish Buków[2]) is a municipality in the Oberspreewald-Lausitz district, in southern Brandenburg, Germany.
Demography
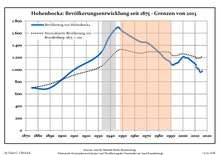
Development of Population since 1875 within the Current Boundaries (Blue Line: Population; Dotted Line: Comparison to Population Development of Brandenburg state; Grey Background: Time of Nazi rule; Red Background: Time of Communist rule)
| Hohenbocka: Population development within the current boundaries (2013)[3] | |||||||||||||||||||||||||||||||||||||||||||||||||||||||||||||||||||||||||||||||||||||||||||||||||||||||||||||||||||||||||||||||
|---|---|---|---|---|---|---|---|---|---|---|---|---|---|---|---|---|---|---|---|---|---|---|---|---|---|---|---|---|---|---|---|---|---|---|---|---|---|---|---|---|---|---|---|---|---|---|---|---|---|---|---|---|---|---|---|---|---|---|---|---|---|---|---|---|---|---|---|---|---|---|---|---|---|---|---|---|---|---|---|---|---|---|---|---|---|---|---|---|---|---|---|---|---|---|---|---|---|---|---|---|---|---|---|---|---|---|---|---|---|---|---|---|---|---|---|---|---|---|---|---|---|---|---|---|---|---|---|
|
| ||||||||||||||||||||||||||||||||||||||||||||||||||||||||||||||||||||||||||||||||||||||||||||||||||||||||||||||||||||||||||||||
References
- ↑ "Bevölkerung im Land Brandenburg nach amtsfreien Gemeinden, Ämtern und Gemeinden 31. Dezember 2017 (Fortgeschriebene amtliche Einwohnerzahlen auf Grundlage des Zensus 2011)". Amt für Statistik Berlin-Brandenburg (in German). 2018.
- ↑ Mapa Polski 1:500 000 Wojskowy Instytut Geograficzny Sztabu Generalnego W.P., Warszawa 1947
- ↑ Detailed data sources are to be found in the Wikimedia Commons.Population Projection Brandenburg at Wikimedia Commons
Towns and municipalities in Oberspreewald-Lausitz | ||
|---|---|---|
This article is issued from
Wikipedia.
The text is licensed under Creative Commons - Attribution - Sharealike.
Additional terms may apply for the media files.