Henry Gantt
| Henry Laurence Gantt | |
|---|---|
 Henry L. Gantt, 1916 | |
| Born |
May 20, 1861 Calvert County, Maryland |
| Died |
November 23, 1919 (aged 58) Montclair, New Jersey |
| Nationality | American |
| Citizenship | United States |
| Alma mater |
Stevens Institute of Technology Johns Hopkins University |
| Known for | Gantt chart |
| Scientific career | |
| Fields | Scientific management |
Henry Laurence Gantt, A.B., M.E. (/ɡænt/; May 20, 1861 – November 23, 1919) was an American mechanical engineer and management consultant who is best known for his work in the development of scientific management. He created the Gantt chart in the 1910s.
Gantt charts were employed on major infrastructure projects including the Hoover Dam and Interstate highway system and continue to be an important tool in project management and program management.
Biography
Early life, education and family
Gantt was born to a slave-owning plantation family in Calvert County, Maryland at the outbreak of the American Civil War. When the war ended the family lost their slaves and land, and moved to Baltimore.[1]
He graduated from McDonogh School in 1878 and from Johns Hopkins University in 1880, then returned to the McDonogh School to teach for three years. He subsequently received a Masters of Engineering degree in mechanical engineering from the Stevens Institute of Technology in New Jersey.[2] Henry Gantt was married to Mary E. Snow of Fitchburg, Massachusetts on 29 Nov 1899.
Career
In 1884 Gantt began working as a draughtsman at the iron foundry and machine-shop Poole & Hunt in Baltimore.[3][4] In 1887 he joined Frederick W. Taylor in applying scientific management principles to the work at Midvale Steel and Bethlehem Steel, working there with Taylor until 1893. In his later career as a management consultant and following the invention of the Gantt chart, he designed the 'task and bonus' system of wage payment and additional measurement methods worker efficiency and productivity.
In 1916, influenced by Thorsten Veblen he set up the New Machine, an association which sought to apply the criteria of industrial efficiency to the political process.[5] With the Marxist[6] Walter Polakov he led a breakaway from the 1916 ASME conference to call for socialising industrial production under the control of managers incorporating Polakov's analysis of inefficiency in the industrial context.[7]
Henry Gantt is listed under Stevens Institute of Technology alumni.[8] The American Society of Mechanical Engineers (ASME) published his biography in 1934 and awards an annual medal in honor of Henry Laurence Gantt.[9]
Work
Henry Gantt's legacy to project management is the following:
- The Gantt chart: Still accepted as an important management tool today, it provides a graphic schedule for the planning and controlling of work, and recording progress towards stages of a project. The chart has a modern variation, Program Evaluation and Review Technique (PERT).
- Industrial Efficiency: Industrial efficiency can only be produced by the application of scientific analysis to all aspects of the work in progress. The industrial management role is to improve the system by eliminating chance and accidents.[10]
- The Task And Bonus System: He linked the bonus paid to managers to how well they taught their employees to improve performance.
- The social responsibility of business: He believed that businesses have obligations to the welfare of the society in which they operate.
Gantt charts
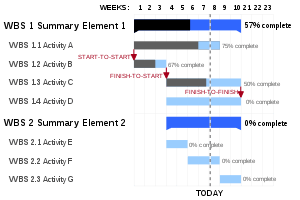
Gantt created many different types of charts.[11] He designed his charts so that foremen or other supervisors could quickly know whether production was on schedule, ahead of schedule, or behind schedule. Modern project management software includes this critical function.
Gantt (1903) describes two types of balances:
- the "man’s record", which shows what each worker should do and did do, and
- the "daily balance of work", which shows the amount of work to be done and the amount that is done.
Gantt gives an example with orders that will require many days to complete. The daily balance has rows for each day and columns for each part or each operation. At the top of each column is the amount needed. The amount entered in the appropriate cell is the number of parts done each day and the cumulative total for that part. Heavy horizontal lines indicate the starting date and the date that the order should be done. According to Gantt, the graphical daily balance is "a method of scheduling and recording work". In this 1903 article, Gantt also describes the use of:
- "production cards" for assigning work to each operator and recording how much was done each day.
Work, Wages, and Profits, 1916
In his 1916 book "Work, Wages, and Profits" Gantt explicitly discusses scheduling, especially in the job shop environment. He proposes giving to the foreman each day an "order of work" that is an ordered list of jobs to be done that day. Moreover, he discusses the need to coordinate activities to avoid "interferences". However, he also warns that the most elegant schedules created by planning offices are useless if they are ignored, a situation that he observed.
Organizing for Work, 1919
In his 1919 book "Organizing for Work" Gantt gives two principles for his charts:
- one, measure activities by the amount of time needed to complete them;
- two, the space on the chart can be used to represent the amount of the activity that should have been done in that time.
Gantt shows a progress chart that indicates for each month of the year, using a thin horizontal line, the number of items produced during that month. In addition, a thick horizontal line indicates the number of items produced during the year. Each row in the chart corresponds to an order for parts from a specific contractor, and each row indicates the starting month and ending month of the deliveries. It is the closest thing to the Gantt charts typically used today in scheduling systems, though it is at a higher level than machine scheduling.
Gantt’s machine record chart and man record chart are quite similar, though they show both the actual working time for each day and the cumulative working time for a week. Each row of the chart corresponds to an individual machine or operator. These charts do not indicate which tasks were to be done, however.
Henry Gantt and Karol Adamiecki
A novel method of displaying interdependencies of processes to increase visibility of production schedules was invented in 1896 by Karol Adamiecki, which was similar to the one defined by Gantt in 1903. However, Adamiecki did not publish his works in a language popular in the West; hence Gantt was able to popularize a similar method, which he developed around the years 1910–1915, and the solution became attributed to Gantt. With minor modifications, what originated as the Adamiecki's chart is now more commonly referred to as the Gantt Chart.[12]
Publications
Gantt published several articles and books. A selection:
- Henry L. Gantt, Dabney Herndon Maury (1884) "The Efficiency of Fluid in Vapor Engines," in: Van Nostrand's engineering magazine, v. 31 July-Dec 1884. p. 413-433
- H. L. Gantt. "A Bonus System of Rewarding Labor," in: Transactions of the ASME 23:341-72.
- Henry L. Gantt (1903) "A graphical daily balance in manufacture," in: Transactions of the American. Society of Mechanical Engineers, 24:1322-1336
- Henry L. Gantt (1908) Training Workmen in Habits of Industry and Coöperation. 12 pages.
- Henry L. Gantt (1910) The Compensation of Workmen ...: A Lecture Delivered Before the Harvard Graduate School of Business Administration, Dec. 15, 1910. 116 pages.
- Henry L. Gantt (1910), Work, Wages, and Profits: Their Influence on the Cost of Living, New York, New York, USA: Engineering Magazine Company, LCCN 10014590. (See also second edition, revised and enlarged.)
- Gantt, Henry L. (1916), Industrial leadership, New Haven: Yale University Press.
- Gantt, Henry L. (1919), Organizing for Work, New York, New York, USA: Harcourt, Brace, and Howe, LCCN 19014919Reprinted by Hive Publishing Company, Easton, Maryland
References
- ↑ Leon P. Alford, Henry Laurence Gantt: Leader in Industry (ASME, 1934). p. 5-6
- ↑ Morgen Witzel (2005). Encyclopedia of History of American Management. p. 192
- ↑ Bernard C. Hilton (2005). A History of Production Planning and Control, 1750-2000, p. 64
- ↑ Sheldrake, John (2003). "Henry Gantt and humanized scientific management". Management Theory (2nd ed.). Thompson Learning. pp. 35–43. ISBN 1-86152-963-5.
- ↑ Maier, Charles S. (1970), "Between Taylorism and Technocracy: European Ideologies and the Vision of Industrial Productivity in the 1920s", Journal of Contemporary History, 5 (2): 27–61, doi:10.1177/002200947000500202, JSTOR 259743
- ↑ Kelly, Diane J. (2004), "Marxist Manager amidst the Progressives: Walter N Polakov and the Taylor Society", Journal of Industrial History, 6 (2): 61–75
- ↑ Wren, Daniel (1980), "Scientific Management in the U.S.S.R., with Particular Reference to the Contribution of Walter N. Polakov", The Academy of Management Review, 5 (1): 1–11, doi:10.5465/amr.1980.4288834, JSTOR 257800
- ↑ Stevens Institute Indicator, Vol. 25-26. (1908), p. 421
- ↑ ASME Henry Laurence Gantt Medal Accessed April 7, 2007.
- ↑ Chatfield, Michael. "Gantt, Henry Laurence (1861-1919)." History of Accounting: An International Encyclopedia, edited by Michael Chatfield and Richard Vangermeersch. New York: Garland Publishing, 1996. P. 269.
- ↑ The discussion of Gantt charts here described originally appeared in Herrmann (2005): Herrmann, Jeffrey W., History of Decision-Making Tools for Production Scheduling, Proceedings of the 2005 Multidisciplinary Conference on Scheduling: Theory and Applications, New York, July 18–21, 2005.
- ↑ Peter W. G. Morris, The Management of Projects, Thomas Telford, 1994, ISBN 0-7277-2593-9, Google Print, p.18
Further reading
- Alford, Leon Pratt (1934). Henry Laurence Gantt: Leader in Industry. Harper & Bros. OCLC 11397692.
- Lyndall Urwick, The Golden Book of Management (1956)
External links
| Wikimedia Commons has media related to Henry Gantt. |
| Wikiquote has quotations related to: Henry Gantt |
- Works by or about Henry Gantt at Internet Archive
- ASME - Henry Laurence Gantt Medal
- International Institute of Management - Management Hall of Fame: Leading Management Gurus
- Gantt.com - Gantt Chart History
- Gantt Chart - Henry Gantt's legacy to Management is the Gantt Chart
- British Library - Management & Business Studies Portal