Government spending in the United States
Government spending in the United States is the spending of the federal government of the United States of America, and the spending of its state and local governments.
Components of federal government spending
For most governments around the world, the majority of government spending takes place at the federal/national level. As of the 21st century, in the United States, approximately two thirds of government spending is spent by the federal government, while the remaining third of government spending is spent by state and local government.[1] Federal government spending in the United States can be broken down into three general categories: mandatory/entitlement spending, discretionary spending, and interest on government debt.[2]
Mandatory/entitlement spending
Mandatory/entitlement spending is spending for programs with funding levels that are automatically determined by the number of eligible recipients in those programs.[1] Mandatory programs are created under authorization laws, meaning that Congress must provide whatever funds are necessary to keep these programs functional. Funding for these programs cannot be adjusted in the annual budget process; on the contrary, the only way Congress can change funding levels for these programs is by amending the authorization laws directly. Each year, the Office of Management and Budget provides an estimate of required funds for these programs, which is included in the annual budget.[2][3]
Mandatory programs include:[4]
- Social Security: Financial support for the elderly.
- Healthcare: Medicare (health insurance for the elderly) and Medicaid (health insurance for low-income individuals).
- Income Security: Disability Assistance, Food and Nutrition Assistance, Supplemental Security Income, Earned Income Tax Credits, and Child Tax Credits.
- Veterans Benefits: Income Security for Veterans and Healthcare Assistance.
- Other: Agriculture, Energy, General Government Services, and International Affairs.
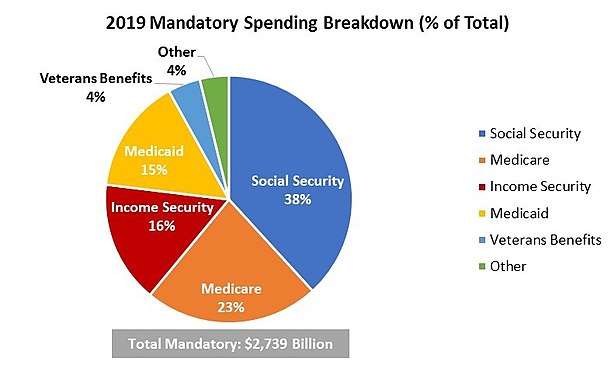
Figure A provides a breakdown of the major mandatory government spending categories as of the fiscal year 2019 budget approved by Congress. As Figure A suggests, Social Security is the single largest mandatory spending item, taking up 38% or nearly $1,050 billion of the $2,736 billion total. The next largest expenditures are Medicare and Income Security, with the remaining amount going to Medicaid, Veterans Benefits, and other programs.[4][5]
Discretionary spending
Discretionary spending is optional spending that is determined by Congress each year through an annual appropriations process.[1] After mandatory spending levels have been estimated by the Office of Management and Budget, discretionary spending is determined by both chambers of Congress and usually includes input from the current president of the United States. Subcommittees in both the House of Representatives and the Senate appropriate discretionary funds for their respective areas, and the two chambers reconcile their differences. Once a final spending bill has been created, passed and signed by the president, the bill becomes law.[1][2]
Discretionary spending includes:[6]
- Defense: Spending attributable to the maintenance and strengthening of the United States Armed Forces. See § National defense spending for additional details.
- Non-defense:
- Transportation: Road improvements and repairs, air traffic control, Amtrak and other infrastructure investments.
- Education: K-12 education grants, school choice programs, disability and special education programs, and lunch assistance.
- Other veterans' benefits.
- Public health, law enforcement, natural resources, and science.
- Housing assistance and community services.
- Foreign affairs and other expenditures.
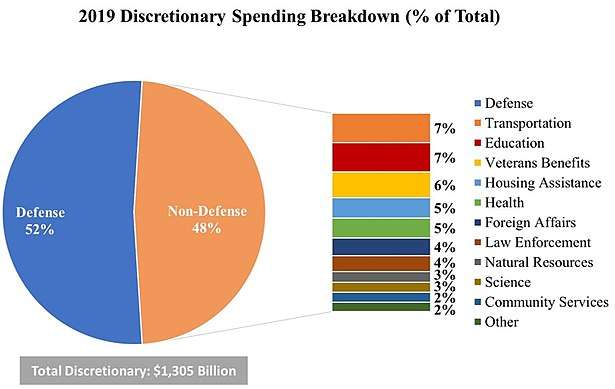
Figure B provides a snapshot of the major discretionary government spending categories as of the fiscal year 2019 budget approved by Congress. As the figure suggests, over 50% of discretionary spending is attributed to national defense. The remaining 48% of funds is divided among non-defense items such as transportation and education. Total discretionary spending approved for the fiscal year 2019 is $1,305 billion, just 28% of total spending.[3]
Interest on government debt
Often times, federal governments spend more money than they collect in tax revenue in a given year. When the government spends more than it brings in, it runs a Budget Deficit that year.[7] In order to pay for the extra spending, governments issue debt. Government debt is the amount of money borrowed from individuals, firms, or foreign entities.[1] Debt accrues over time. Most public debt is held in the form of treasury bills and bonds, and the government has to pay down debt over time. In order to provide an incentive for individuals, businesses and other entities to lend money, the government must also pay these parties interest on the debt.[8] The interest expense for fiscal year 2019 is $363 billion, or 7.9% of the total budget. According to estimates from the Office of Management and Budget, interest on government debt is expected to more than double by 2028 and account for a larger percentage of total expenditures.[3]
State and local government spending
At the beginning of the 20th century, the majority of government spending in the United States took place at the local level. However, federal spending increased relative to state and local spending as a result of World War I and World War II, and by the 1930s, state and local government spending accounted for less than one half of government spending. By 2010, federal spending was more than 20% of GDP, while state and local spending ranged from 8%-10% of GDP.[8][9] As a result, in recent years, state and local governments account for approximately 1/3 of total government expenditures.[1] State and local government spending is typically spent in 6 broad categories: elementary and secondary education, higher education, health, welfare, police and safety, and transportation.[1][10] Over the last few decades, funding for education at the state level has fallen, while funding for health has more than doubled.[11]
While federal governments often run budget deficits (where government spending > government tax revenue), state governments usually have balanced budgets.[1] A balanced budget is when government spending in a given year equals government revenue in that year.[12][13] This high degree of fiscal responsibly is a result of most states in the U.S. having balanced budget requirements.[14] A balanced budget requirement is a law that requires a government to balance its budget annually, such that government spending equals government revenue.[15] There are two types of balanced budget requirements: ex-post balanced budget requirements, and ex-ante balanced budget requirements. An ex-post balanced budget requirement stipulates that a government must balance their budget by the end of each fiscal year, while an ex-ante balanced budget requirement dictates that a state must adopt a balanced budget at the beginning of each fiscal year. Ex-ante balanced budget requirements rely on estimates and assumptions about future costs and revenue growth, so they are more easily manipulated.[1][15]
California
With a population of nearly 40 million as of 2018, California has by far the largest annual state expenditures.[16][17] California receives a significant amount of money from the federal government, especially for healthcare and welfare programs, but also has large in-state expenditures.[18] According to California's Department of Finance, the state's 2017-2018 enacted state budget includes over $180 billion in state funds.[16] As can be seen below, Table 1 gives an overview of California's 2017-2018 enacted state budget. As the table suggests, health care and K12 education represent California's largest expenditures of state funds. The largest health care expenditure is for California's Medi-Cal program, a health insurance program for low-income families in California.[19][20] In addition, health care spending is focused on women's health services, treatment for addiction, and dentistry.[19] As Table 1 suggests, California also spends significantly on higher education, police, and transportation, with smaller portions of funding attributable to environmental protection and other activities.[16]
| State Agency | State Funds ($ Billions) | Percent (%) of Total |
|---|---|---|
| Health Care | $60.3 | 33% |
| K12 Education | $54.2 | 30% |
| Higher Education | $15.4 | 8% |
| Corrections and Rehab | $13.9 | 8% |
| Transportation | $13.0 | 7% |
| General Government | $7.9 | 4% |
| Legislative, Judicial, and Executive | $6.7 | 4% |
| Natural Resources | $5.2 | 3% |
| Environmental Protection | $3.2 | 2% |
| Business and Consumer Services | $1.7 | 1% |
| Other | $1.6 | 1% |
| Total | $183.3 | 100% |
National defense spending
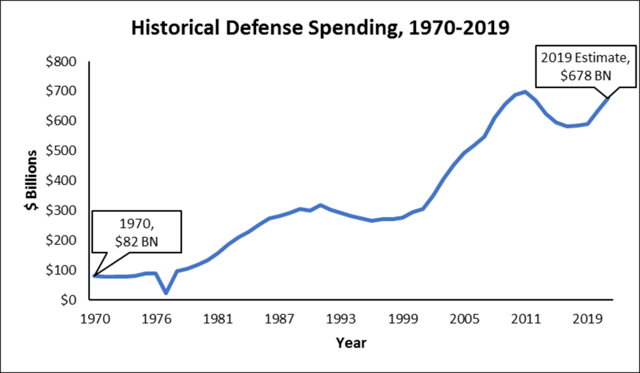
National defense spending is any government spending attributable to the maintenance and strengthening of the United States Armed Forces, including the Army, Navy, Marines, and the Air Force.[21] As of the fiscal year 2019 budget approved by Congress, national defense is the second largest expenditure in the federal budget.[6] Figure D provides a historical picture of military spending over the last few decades. In 1970, the United States government spent just over $80 billion on national defense. Over the next two decades, national defense spending increased steadily to around $300 billion per year.[3] Military spending fell in the 1990s, but increased markedly in the 2000s as a result of the War in Afghanistan and Iraq. Military spending was cut slightly during the Obama Administration, but the Trump Administration plans to ramp up military spending to combat ISIL. National defense spending is expected to be $678 billion in 2019, an amount greater than the military expenditures of the next 9 countries combined.[22]
Key defense expenditures typically include:[23]
- Power Projection: Spending on sea power and air power, including nuclear submarines, aircraft, and aircraft carriers.
- Munitions: Maintenance of existing ammunition inventory, as well as procurement of new ammunition.
- Nuclear Deterrence: Maintaining and expanding all nuclear systems.
- Overseas Contingency Operations: Funds available for unexpected warfare abroad. For example, these funds were used to pay for the wars in Iraq and Afghanistan.
- Missile Defense: Improvements in missile defense technology and integration of current technology at home and abroad.
- Space Systems and Cyberspace Operations: Communication control and radar technology.
References
- 1 2 3 4 5 6 7 8 9 Jonathan, Gruber. Public Finance and Public Policy (Fifth ed.). New York: Worth Publishers. ISBN 9781464143335. OCLC 914290290.
- 1 2 3 Irving, Susan (1995). Budget Policy: Issues in Capping Mandatory Spending. https://www.gao.gov/assets/160/154498.pdf: United States General Accounting Office.
- 1 2 3 4 "Efficient, Effective, Accountable: An American Budget" (PDF). Office of Management and Budget: 2018.
- 1 2 "Historical Tables: Table 8.5—Outlays for Mandatory and Related Programs: 1962–2023". Office of Management and Budget. 2018. Retrieved 2018-02-23.
- ↑ Amadeo, Kimberly (2018). "Current Federal Mandatory Spending". The Balance. Retrieved 2018-02-23.
- 1 2 "Historical Tables: Table 8.7—Outlays for Discretionary Programs: 1962–2023". Office of Management and Budget. 2018. Retrieved 2018-02-23.
- ↑ Taylor, Timothy, (2017). Principles of Macroeconomics: Economics and the Economy (Fourth ed.). Minneapolis: Textbook Media Press. pp. 366–340. ISBN 9780996996334. OCLC 1001342630.
- 1 2 Stiglitz, Joseph (2015). Economics of the Public Sector (Fourth ed.). New York: W. W. Norton & Company. ISBN 9780393937091. OCLC 909815898.
- ↑ "Federal, State, Local Spending in 20th Century". US Government Spending. 2018. Retrieved 2018-02-26.
- ↑ "State and Local Expenditures". Urban Institute. 2011. Retrieved 2018-02-26.
- ↑ "U.S. Spends Less as Other Nations Invest More in Education". U.S. News and World Report. 2017.
- ↑ Gregory, Mankiw (2014). Principles of Economics (Seventh ed.). Stamford, CT: Southwestern Publishing Group. ISBN 9781285165875. OCLC 884664951.
- ↑ "Balanced Budget". Investopedia. 2008. Retrieved 2018-02-26.
- ↑ Briffault, Richard (1996). Balancing Acts: The Reality Behind State Balanced Budget Requirements. New York: Twentieth Century Fund Press. ISBN 9780870783944. OCLC 34746066.
- 1 2 Wagner, Richard (2012). Deficits, Debt, and Democracy: Wrestling With Tragedy on the Fiscal Commons. Cheltenham: Edward Elgar. ISBN 9780857934598. OCLC 758983823.
- 1 2 3 "Enacted Budget Detail". www.ebudget.ca.gov. 2018. Retrieved 2018-02-26.
- ↑ "Total State Government Expenditures". Ballotpedia. 2016. Retrieved 2018-02-26.
- ↑ "Overview of the California State Budget". LA Times. Retrieved 2018-02-26.
- 1 2 "Health and Human Services" (PDF). www.ebudget.ca.gov. 2018.
- ↑ "Medi-Cal Program Overview". www.coveredca.com. 2018. Retrieved 2018-02-27.
- ↑ Korb, Lawrence (2014). "A User's Guide to the Fiscal Year 2015 Defense Budget". Center for American Progress. Retrieved 2018-02-23.
- ↑ Amadeo, Kimberly (2018). "U.S. Military Budget: Components, Challenges, Growth". The Balance. Retrieved 2018-02-23.
- ↑ Norquist, David (2018). "Defense Budget Overview" (PDF). Office of the Undersecretary of Defense.