Functional near-infrared spectroscopy
| Functional near-infrared spectroscopy | |
|---|---|
| Medical diagnostics | |
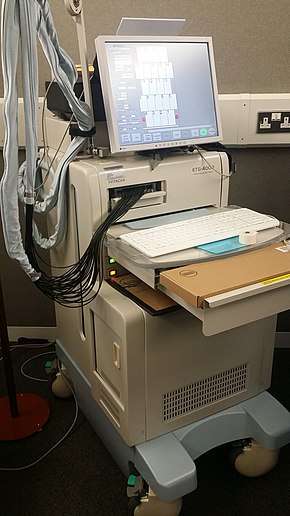 Hitachi ETG-4000 fNIRS]] | |
| Purpose | brain activity is measured through hemodynamic responses |
Functional Near-Infrared Spectroscopy (fNIRS), is the use of near-infrared spectroscopy (NIRS) for the purpose of functional neuroimaging. Using fNIRS, brain activity is measured through hemodynamic responses associated with neuron behaviour.
fNIRS has been successfully implemented as a control signal for BCI systems.[1][2][3][4][5]
Description
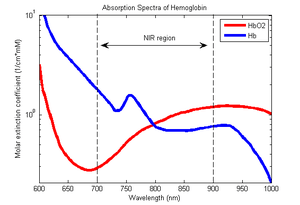
fNIRS is a non-invasive imaging method involving the quantification of chromophore concentration resolved from the measurement of near infrared (NIR) light attenuation or temporal or phasic changes. NIR spectrum light takes advantage of the optical window in which skin, tissue, and bone are mostly transparent to NIR light in the spectrum of 700–900 nm, while hemoglobin (Hb) and deoxygenated-hemoglobin (deoxy-Hb) are stronger absorbers of light. Differences in the absorption spectra of deoxy-Hb and oxy-Hb allow the measurement of relative changes in hemoglobin concentration through the use of light attenuation at multiple wavelengths. Two or more wavelengths are selected, with one wavelength above and one below the isosbestic point of 810 nm at which deoxy-Hb and oxy-Hb have identical absorption coefficients. Using the modified Beer-Lambert law (mBLL), relative concentration can be calculated as a function of total photon path length. Typically the light emitter and detector are placed ipsilaterally on the subjects skull so recorded measurements are due to back-scattered (reflected) light following elliptical pathways.
Functional imaging
The use of fNIRS as a functional imaging method relies on the principle of neuro-vascular coupling also known as the haemodynamic response or blood-oxygen-level dependent (BOLD) response. This principle also forms the core of fMRI techniques. Through neuro-vascular coupling, neuronal activity is linked to related changes in localized cerebral blood flow. fNIRS and fMRI are sensitive to similar physiologic changes and are often comparative methods. Studies relating fMRI and fNIRS show highly correlated results in cognitive tasks.[6] fNIRS has several advantages in cost and portability over fMRI, but cannot be used to measure cortical activity more than 4 cm deep due to limitations in light emitter power and has more limited spatial resolution. fNIRS includes the use of diffuse optical tomography (DOT/NIRDOT) for functional purposes. Multiplexing fNIRS channels can allow 2D topographic functional maps of brain activity (e.g. with Hitachi ETG-4000 or Artinis Oxymon) while using multiple emitter spacings may be used to build 3D tomographic maps.
History
In 1977, Jöbsis[7] reported that brain tissue transparency to NIR light allowed a non-invasive and continuous method of tissue oxygen saturation using transillumination in neonates. Transillumination (forward-scattering) was of limited utility in adults because of light attenuation and was quickly replaced by reflectance-mode based techniques. Development of NIRS systems proceeded rapidly and by 1985, the first studies on cerebral oxygenation were conducted by M. Ferrari.[8] NIRS techniques were expanded on by the work of Randall Barbour,[9] Britton Chance,[10] Arno Villringer,[11] M. Cope, D. T. Delpy,[12] Enrico Gratton, and others.
Spectroscopic techniques
There are four current methods of fNIR Spectroscopy.
Continuous wave
Continuous wave (CW) fNIRS uses light sources which emit light at a constant frequency and amplitude. Changes in light intensity can be related to changes in relative concentrations of hemoglobin through the modified Beer–Lambert law (mBLL).[13]
![{\displaystyle {\text{OD}}=\operatorname {log} _{10}(I_{0}/I)=\epsilon \cdot [X]\cdot l\cdot {\text{DPF}}+G}](../I/m/44f01f0fbdb7d334f37b04b12384ce4df25e402d.svg)
Where is the optical density or attenuation, is emitted light intensity, is measured light intensity, is the attenuation coefficient, is the chromophomore concentration, is the distance between source and detector and is the differential path length factor, and is a geometric factor associated with scattering.


![[X]](../I/m/fadb3aef0836cb1d004479f470703a45972bf8fe.svg)


When the attenuation coefficients are known, constant scattering loss is assumed, and the measurements are treated differentially in time, the equation reduces to:
![{\displaystyle \Delta [X]=\Delta {\frac {\text{OD}}{\epsilon d}}}](../I/m/a02d0a004d3011f7a93471acb7b21853a83fb96c.svg)
Where is the total corrected photon path-length.

Using a dual wavelength system, measurements for oxy-Hb (HbO2) and Deoxy-Hb(Hb) can be solved from the matrix equation:[14]
![{\displaystyle {\begin{pmatrix}\Delta {\text{OD}}_{\lambda _{1}}\\\Delta {\text{OD}}_{\lambda _{2}}\end{pmatrix}}={\begin{pmatrix}\epsilon _{\lambda _{1}}^{\text{Hb}}d&\epsilon _{\lambda _{1}}^{{\text{HbO}}_{2}}d\\\epsilon _{\lambda _{2}}^{\text{Hb}}d&\epsilon _{\lambda _{2}}^{{\text{HbO}}_{2}}d\end{pmatrix}}{\begin{pmatrix}\Delta [X]^{\text{Hb}}\\\Delta [X]^{{\text{HbO}}_{2}}\end{pmatrix}}}](../I/m/233ca031c5dfffcfd7ef9b68b4a2524e79fe8e50.svg)
Due to their simplicity and cost-effectiveness, CW technologies are by far the most common form of functional NIRS. Measurement of absolute changes in concentration with the mBLL requires the knowledge of photon path-length. Continuous wave methods do not have any knowledge of photon path-length and so changes in concentration are relative to an unknown path-length. Many CW-fNIRS commercial systems use estimations of photon path-length derived from computerized Monte-Carlo simulations and physical models to provide absolute quantification of hemoglobin concentrations.
Simplicity of principle allows CW devices to be rapidly developed for different applications such as neonatal care, patient monitoring systems, optical tomography systems, and more. Wireless CW systems have been developed, allowing monitoring of individuals in ambulatory, clinical[15] and sports environments.[16][17][18]
Frequency domain
In frequency domain (FD) systems, NIR laser sources provide an amplitude modulated sinusoid at frequencies near one hundred megahertz (100 MHz). Changes in the back-scattered signal's amplitude and phase provide a direct measurement of absorption and scattering coefficients of the tissue, thus obviating the need for information about photon path-length; from the scattering and absorption coefficients the changes in the concentration of hemodynamic parameters are determined. Because of the need for modulated lasers as well as phasic measurements, frequency domain systems are more technically complex than continuous wave systems. However, these systems are capable of providing absolute concentrations of oxy-Hb and deoxy-Hb.

Time-resolved
In time-resolved spectroscopy, a short NIR pulse is introduced with a pulse length usually on the order of picoseconds. Through time-of-flight measurements, photon path-length may be directly observed by dividing resolved time by the speed of light. Because of the need for high-speed detection and high-speed emitters, time-resolved methods are the most expensive and technically complicated method. Information about hemodynamic changes can be found in the attenuation, decay, and time profile of the back-scattered signal.
Spatially-resolved spectroscopy
Spatially-resolved spectroscopy (SRS) systems use localized gradients in light attenuation to determine absolute ratios of oxy-Hb and deoxy-Hb. Using a spatial measurement, SRS systems do not require knowledge of photon path-length to make this calculation, however measured concentrations of oxy-Hb and deoxy-Hb are relative to the unknown coefficient of scattering in the media. This technique is most commonly used in cerebral oxymetry systems that report a Tissue Oxygenation Index (TOI) or Tissue Saturation Index (TSI).[19]
See also
| Wikimedia Commons has media related to Near-infrared spectroscopy. |
References
- ↑ Ayaz, H.; Shewokis, P. A.; Bunce, S.; Onaral, B. (2011). "An optical brain computer interface for environmental control". 2011 Annual International Conference of the IEEE Engineering in Medicine and Biology Society. p. 6327. doi:10.1109/IEMBS.2011.6091561. ISBN 978-1-4577-1589-1.
- ↑ Coyle, S. M.; Ward, T. S. E.; Markham, C. M. (2007). "Brain–computer interface using a simplified functional near-infrared spectroscopy system". Journal of Neural Engineering. 4 (3): 219–226. doi:10.1088/1741-2560/4/3/007. PMID 17873424.
- ↑ Sitaram, R.; Zhang, H.; Guan, C.; Thulasidas, M.; Hoshi, Y.; Ishikawa, A.; Shimizu, K.; Birbaumer, N. (2007). "Temporal classification of multichannel near-infrared spectroscopy signals of motor imagery for developing a brain–computer interface". NeuroImage. 34 (4): 1416–1427. doi:10.1016/j.neuroimage.2006.11.005. PMID 17196832.
- ↑ Naseer N.; Hong M.J.; Hong K.-S. (2014). "Online binary decision decoding using functional near-infrared spectroscopy for the development of brain-computer interface". Experimental Brain Research. 232 (2): 555–564. doi:10.1007/s00221-013-3764-1.
- ↑ Naseer N.; Hong K.-S. (2013). "Classification of functional near-infrared spectroscopy signals corresponding to the right- and left-wrist motor imagery for development of a brain-computer interfaces". Neuroscience Letters. 553: 84–89. doi:10.1016/j.neulet.2013.08.021. PMID 23973334.
- ↑ Cui, X.; Bray, S.; Bryant, D. M.; Glover, G. H.; Reiss, A. L. (2011). "A quantitative comparison of NIRS and fMRI across multiple cognitive tasks". NeuroImage. 54 (4): 2808–2821. doi:10.1016/j.neuroimage.2010.10.069. PMC 3021967. PMID 21047559.
- ↑ Jobsis, F. (1977). "Noninvasive, infrared monitoring of cerebral and myocardial oxygen sufficiency and circulatory parameters". Science. 198 (4323): 1264–1267. doi:10.1126/science.929199. PMID 929199.
- ↑ Ferrari, M.; Giannini, I.; Sideri, G.; Zanette, E. (1985). "Continuous non invasive monitoring of human brain by near infrared spectroscopy". Advances in Experimental Medicine and Biology. 191: 873–882. doi:10.1007/978-1-4684-3291-6_88. PMID 3008520.
- ↑ Schlereth, F. H.; Fossaceca, J. M.; Keckler, A. D.; Barbour, R. L. (1991). "Multicomputer-based neural networks for imaging in random media". Conference Record of the 1991 IEEE Nuclear Science Symposium and Medical Imaging Conference. p. 2193. doi:10.1109/NSSMIC.1991.259308. ISBN 0-7803-0513-2.
- ↑ Chance, B.; Zhuang, Z.; Unah, C.; Alter, C.; Lipton, L. (1993). "Cognition-activated low-frequency modulation of light absorption in human brain". Proceedings of the National Academy of Sciences of the United States of America. 90 (8): 3770–3774. doi:10.1073/pnas.90.8.3770. PMC 46383. PMID 8475128.
- ↑ Villringer, A.; Planck, J.; Hock, C.; Schleinkofer, L.; Dirnagl, U. (1993). "Near infrared spectroscopy (NIRS): A new tool to study hemodynamic changes during activation of brain function in human adults". Neuroscience Letters. 154 (1–2): 101–104. doi:10.1016/0304-3940(93)90181-J. PMID 8361619.
- ↑ Delpy, D. T.; Cope, M.; Zee, P. V. D.; Arridge, S.; Wray, S.; Wyatt, J. (1988). "Estimation of optical pathlength through tissue from direct time of flight measurement". Physics in Medicine and Biology. 33 (12): 1433–1442. doi:10.1088/0031-9155/33/12/008. PMID 3237772.
- ↑ Villringer, A.; Chance, B. (1997). "Non-invasive optical spectroscopy and imaging of human brain function". Trends in Neurosciences. 20 (10): 435–442. doi:10.1016/S0166-2236(97)01132-6. PMID 9347608.
- ↑ Ayaz, H.; Shewokis, P. A.; Curtin, A.; Izzetoglu, M.; Izzetoglu, K.; Onaral, B. (2011). "Using MazeSuite and Functional Near Infrared Spectroscopy to Study Learning in Spatial Navigation". Journal of Visualized Experiments (56). doi:10.3791/3443. PMC 3227178.
- ↑ Ieong, Hada Fong-ha; Yuan, Zhen (2017-04-19). "Abnormal resting-state functional connectivity in the orbitofrontal cortex of heroin users and its relationship with anxiety: a pilot fNIRS study". Scientific Reports. 7. doi:10.1038/srep46522. ISSN 2045-2322.
- ↑ https://clinicaltrials.gov/ct2/show/NCT02351583
- ↑ http://optics.org/news/5/12/16
- ↑ http://www.newswise.com/articles/view/518934/
- ↑ Suzuki, S. (1999). "Tissue oxygenation monitor using NIR spatially resolved spectroscopy". Proceedings of SPIE. 3597. p. 582. doi:10.1117/12.356862.