Fracture toughness
In materials science, fracture toughness is a property which describes the ability of a material to resist fracture, and is one of the most important properties of any material for many design applications. The linear-elastic fracture toughness of a material is determined from the stress intensity factor ( ) at which a thin crack in the material begins to grow. It is denoted KIc and has the units of or . Plastic-elastic fracture toughness is denoted by JIc, with the unit of J/cm2 or lbf-in/in2, and is a measurement of the energy required to grow a thin crack.


The subscript I denotes mode I crack opening under a normal tensile stress perpendicular to the crack, since the material can be made deep enough to stand shear (mode II) or tear (mode III).
Fracture toughness is a quantitative way of expressing a material's resistance to brittle fracture when a crack is present. A material with high fracture toughness may undergo ductile fracture as opposed to brittle fracture. Brittle fracture is characteristic of materials with low fracture toughness.[1]
Fracture mechanics, which leads to the concept of fracture toughness, was broadly based on the work of A. A. Griffith who, among other things, studied the behavior of cracks in brittle materials.
A related concept is the work of fracture ( ) which is directly proportional to , where is the Young's modulus of the material.[2] Note that, in SI units, is given in J/m2.


Fracture toughness and materials class
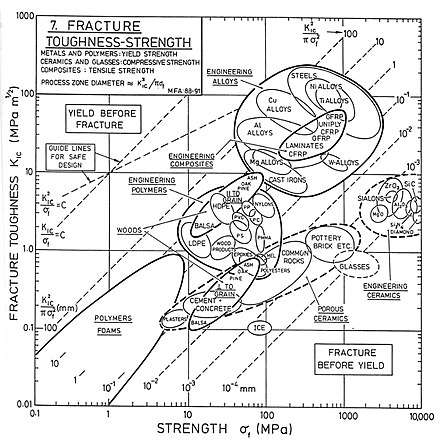
Just as the elastic properties of materials, like elastic moduli and strength, vary among material class, so too does the fracture toughness. Figure 1 graphs the fracture toughness vs. strength for various materials and materials classes.[3] However, unlike most elastic properties, fracture toughness displays a wide variation across materials, about 4 orders of magnitude. As can be expected, metals hold the highest values of fracture toughness. Since cracks cannot easily propagate in tough materials, this makes metals highly resistant to cracking under stress and gives their stress–strain curve a large zone of plastic flow. Comparatively, engineering ceramics have a lower fracture toughness, which leads to ease of cracking, but show an exceptional improvement in the stress fracture that is attributed to their 1.5 orders of magnitude strength increase, relative to metals. Of note is the fracture toughness of composites (made by combining engineering ceramics with engineering polymers) (in the zone of engineering alloys), which greatly exceeds the individual fracture toughness of the constituent materials.
Within material groups (classes) there is a further subdivision that depends on the relation between strength and toughness between different material subgroups. The ovals, or "balloons" within each material class tend to have a sloping trend that describes the subgroup's strength-toughness relationship. For example, take the alloy system's downward sloping trend. This relationship indicates, that within an alloy class an increase in strength leads to a decrease in fracture toughness regardless of the strengthening mechanism used. For this reason, it is beneficial to think of an increase in strength (within the engineering alloys) as a direct decrease in fracture toughness, which is correlated with a lower ductility of the material. This however, is not the trend for other material classes. As a first example, consider the polymer foams and porous ceramics. In direct contrast to alloys, the trend in this material class is to have an upward slope. Explicitly, when the strength of these materials is increased we can expect to see an accompanied increase in fracture toughness. Indeed, in the subgroup of basal and ash we observe a close to one order of magnitude increase in both properties. Porous ceramics have been shown to behave exactly like this under both compression stress and tensile stress, however, the fracture toughness values are ten times lower under tension. This behavior can most easily be grasped by considering the porosity of these materials, where these voids can be modeled as preexisting cracks, which increase the nucleation energy of cracks under stress and impede the propagation of these cracks. Note that the engineering ceramics also show the same sloping trend as the porous ceramics, however, the slope is much greater, which makes it less noticeable in the log-scale.
In general, materials that are on the upper left most part of the diagram are used to design a system's failure against flow, because these materials yield before they are fractured. While materials on the lower right most part of the diagram are used to design a system's failure against fracture, because these materials fracture before yielding.
Example values
The following table shows some typical values of fracture toughness for various materials:
| Material type | Material | KIc (MPa · m1/2) |
|---|---|---|
| Metal | Aluminum alloy (7075) | 24 |
| Steel alloy (4340) | 50 | |
| Titanium alloy | 44–107[4] | |
| Aluminum | 14–28 | |
| Ceramic | Aluminum oxide | 3–5 |
| Silicon carbide | 3–5 | |
| Soda-lime glass | 0.7–0.8 | |
| Concrete | 0.2–1.4 | |
| Polymer | Polymethyl methacrylate | 0.7–1.60 |
| Polystyrene | 0.7–1.1 | |
| Composite | Mullite-fibre composite | 1.8–3.3[5] |
| Silica aerogels | 0.0008–0.0048[6] |
Stability of crack growth
Consider a body with flaws (cracks) that is subject to a load; the stability of the crack can be assessed as follows. We can assume for simplicity that the loading is of constant displacement or displacement controlled type (such as loading with a screw jack); we can also simplify the discussion by characterizing the crack by its area, A. If we consider an adjacent state of the body as being one with a broader crack (area A+dA), we can then assess strain energy in the two states and evaluate strain energy release rate.
The rate is reckoned with respect to the change in crack area, so if we use U for strain energy, the strain energy release rate is numerically dU/dA. It may be noted that for a body loaded in constant displacement mode, the displacement is applied and the force level is dictated by stiffness (or compliance) of the body. If the crack grows in size, the stiffness decreases, so the force level will decrease. This decrease in force level under the same displacement (strain) level indicates that the elastic strain energy stored in the body is decreasing—is being released. Hence the term strain energy release rate which is usually denoted with symbol G.
The strain energy release rate is higher for higher loads and broader cracks. If the strain energy so released exceeds a critical value Gc, then the crack will grow spontaneously. For brittle materials, Gc can be equated to the surface energy of the (two) new crack surfaces; in other words, in brittle materials, a crack will grow spontaneously if the strain energy released is equal to or more than the energy required to grow the crack surface(s). The stability condition can be written as
- elastic energy released = surface energy created.
If the elastic energy released is less than the critical value, then the crack will not grow; equality signifies neutral stability and if the strain energy release rate exceeds the critical value, the crack will start growing in an unstable manner. For ductile materials, energy associated with plastic deformation has to be taken into account. When there is plastic deformation at the crack tip (as occurs most often in metals) the energy to propagate the crack may increase by several orders of magnitude as the work related to plastic deformation may be much larger than the surface energy. In such cases, the stability criterion has to be restated as
- elastic energy released = surface energy + plastic deformation energy.
The problem can also be formulated in terms of stress instead of energy, leading to the terms stress intensity factor K (or KI for mode I) and critical stress intensity factor Kc (and KIc). These Kc and KIc (etc.) quantities are commonly referred to as fracture toughness, though it is equivalent to use Gc. Typical values for KIcare 150 MN/m3/2 for ductile (very tough) metals, 25 for brittle ones and 1–10 for glasses and brittle polymers. Notice the different units used by GIc and KIc. Engineers tend to use the latter as an indication of toughness.
Conjoint action
There are number of instances where this picture of a critical crack is modified by corrosion. Thus, fretting corrosion occurs when a corrosive medium is present at the interface between two rubbing surfaces. Fretting (in the absence of corrosion) results from the disruption of very small areas that bond and break as the surfaces undergo friction, often under vibrating conditions. The bonding contact areas deform under the localised pressure and the two surfaces gradually wear away. Fracture mechanics dictates that each minute localised fracture has to satisfy the general rule that the elastic energy released as the bond fractures has to exceed the work done in plastically deforming it and in creating the (very tiny) fracture surfaces. This process is enhanced when corrosion is present, not least because the corrosion products act as an abrasive between the rubbing surfaces.
Fatigue is another instance where cyclical stressing, this time of a bulk lump of metal, causes small flaws to develop. Ultimately one such flaw exceeds the critical condition and fracture propagates across the whole structure. The fatigue life of a component is the time it takes for criticality to be reached, for a given regime of cyclical stress. Corrosion fatigue is what happens when a cyclically stressed structure is subjected to a corrosive environment at the same time. This not only serves to initiate surface cracks but (see below) actually modifies the crack growth process. As a result, the fatigue life is shortened, often considerably.
Stress-corrosion cracking (SCC)
This phenomenon is the unexpected sudden failure of normally ductile metals subjected to a constant tensile stress in a corrosive environment. Certain austenitic stainless steels and aluminium alloys crack in the presence of chlorides, mild steel cracks in the presence of alkali (boiler cracking) and copper alloys crack in ammoniacal solutions (season cracking). Worse still, high-tensile structural steels crack in an unexpectedly brittle manner in a whole variety of aqueous environments, especially chloride. With the possible exception of the latter, which is a special example of hydrogen cracking, all the others display the phenomenon of subcritical crack growth; i.e. small surface flaws propagate (usually smoothly) under conditions where fracture mechanics predicts that failure should not occur. That is, in the presence of a corrodent, cracks develop and propagate well below KIc. In fact, the subcritical value of the stress intensity, designated as KIscc, may be less than 1% of KIc, as the following table shows:
| Alloy | KIc ( ) | SCC environment | KIscc ( ) |
| 130 million steel | 60 | 3% NaCl | 12 |
| 18Cr-8Ni | 200 | 42% MgCl2 | 10 |
| Cu-30Zn | 200 | NH4OH, pH7 | 1 |
| Al-3Mg-7Zn | 25 | aqueous halides | 5 |
| Ti-6Al-4V | 60 | 0.6M KCl | 20 |

The subcritical nature of propagation may be attributed to the chemical energy released as the crack propagates. That is,
- elastic energy released + chemical energy = surface energy + deformation energy.
The crack initiates at KIscc and thereafter propagates at a rate governed by the slowest process, which most of the time is the rate at which corrosive ions can diffuse to the crack tip. As the crack advances so K rises (because crack size appears in the calculation of stress intensity). Finally it reaches KIc, whereupon swift fracture ensues and the component fails. One of the practical difficulties with SCC is its unexpected nature. Stainless steels, for example, are employed because under most conditions they are passive; i.e. effectively inert. Very often one finds a single crack has propagated whiles the left metal surface stays apparently unaffected.
Toughening mechanisms
Intrinsic mechanisms
Intrinsic toughening mechanisms are processes which act ahead of the crack tip to increase the material's toughness. These will tend to be related to the structure and bonding of the base material, as well as microstructural features and additives to it. Examples of mechanisms include crack deflection by secondary phases, crack bifurcation due to fine grain structure and modification to the grain boundaries, and crack meandering by pores in the material. Any alteration to the base material which increases its ductility can also be thought of as intrinsic toughening.[7]
Extrinsic mechanisms
Extrinsic toughening mechanisms are processes which act behind the crack tip to resist its further opening. Examples include fibre/lamella bridging, where these structures hold the two fracture surfaces together after the crack has propagated through the matrix, crack wedging from the friction between two rough fracture surfaces, microcracking, where smaller cracks form in the material around the main crack, relieving the stress at the crack tip by effectively increasing the material's compliance, and transformation toughening.[8]
"Transformation toughening" is a phenomenon whereby a material undergoes one or more martensitic (displacive, diffusionless) phase transformations which result in an almost instantaneous change in volume of that material. This transformation is triggered by a change in the stress state of the material, such as an increase in tensile stress, and acts in opposition to the applied stress. Thus when the material is locally put under tension, for example at the tip of a growing crack, it can undergo a phase transformation which increases its volume, lowering the local tensile stress and hindering the crack's progression through the material. This mechanism is exploited to increase the toughness of ceramic materials, most notably in Yttria-stabilized zirconia for applications such as ceramic knives and thermal barrier coatings on jet engine turbine blades.[9]
This martensitic transformation occurs as a result of stress and parallels elastic transformation, it is also quite similar to the transformation that occurs within TRIP steels, but that martensitic transformation is a result of plastic strain. The two phases that exists within pure Zirconia are the tetragonal form at high temperature, and the monoclinic form at low temperature. The transformation in pure Zirconia contains significant shear (ca. 7%) and dilatational strains (ca. 4%). Thermal cracking and even loss of key structural principles can result from these strains if cooling occurs rapidly. Additionally, cooling induces this transformation sluggishly as only a small fraction of the tetragonal form actually transforms. For specific PSZ compositions, the transformation transition temperature falls below room temperature with stress assistance. Figure 1 illustrates the transformation induced via a crack and its corresponding stress field. If tetragonal particles lie within one radius (rc) of the crack fracture plane, certain particles transform into the monoclinic phase, and the material toughness increases as a result of the work invested into the transformation process.[10]
The toughness contributed from transformation toughness is quite analogous to that from crack toughening, and the equations involved will be quite similar. Key parameters include the stress, which induces the transformation, the transformational strain, and the composition within one rc of the crack. This distance is dependent upon the fracture toughness of the matrix along with the inducing stress. Furthermore, the phenomena within transformation toughening also parallel those within microcrack toughening. The grain-size effect of microcrack toughness is quite analogous to the particle-size effect prevalent within transformation toughening. This causes the stress required to initiate martensitic transformation to decrease with increasing tetragonal particle size due to the fact that larger particles result in a lower constraint from the cubic matrix on the transformation. For particularly large particle sizes, the transformation can spontaneously occur while cooling, yet again similar to the spontaneous crack formation in microcrack toughness. However, toughness can also become too low if particle size is too small resulting in a decreased rc due to higher stresses since rc ~ stress−2 during cooling. Therefore, transformational toughness contains an optimum particle size similar to the optimal grain size present for microcrack toughening.[10]
Crack repair
Toughening of a material, such as concrete, which contains numerous pre-existing cracks can be achieved by crack repair. The repair of cracks is often carried out through the infiltration under pressure of binders or resin and can also be achieved by drilling a hole at the crack tip to alleviate stress concentration. This approach turns a propagating crack in to a keyhole notch with a moderated stress concentration.
Effect of grains and inclusions on crack propagation
Propagation of cracks in grains
The presence of grains in a material can affect its toughness by affecting the way cracks propagate. In front of a crack, a plastic zone can be present as the material yields. Beyond that region, the material remains elastic. The conditions for fracture are the most favorable at the boundary between this plastic and elastic zone, and thus cracks often initiate by the cleavage of a grain at that location.
At low temperatures, where the material can become completely brittle, such as in a body-centered cubic (BCC) metal, the plastic zone shrinks away, and only the elastic zone exists. In this state, the crack will propagate by successive cleavage of the grains. At these low temperatures, the yield strength is high, but the fracture strain and crack tip radius of curvature are low, leading to a low toughness.[10]
At higher temperatures, the yield strength decreases, and leads to the formation of the plastic zone. Cleavage is likely to initiate at the elastic-plastic zone boundary, and then link back to the main crack tip. This is usually a mixture of cleavages of grains, and ductile fracture of grains known as fibrous linkages. The percentage of fibrous linkages increase as temperature increases until the linkup is entirely fibrous linkages. In this state, even though yield strength is lower, the presence of ductile fracture and a higher crack tip radius of curvature results in a higher toughness.[10]
It is worth noting that depending on the crystal structure, this behavior can be different. For example, face-centered cubic (FCC) metals remain ductile even at low temperatures, so a plastic zone is always present.
Presence of inclusions
Inclusions in a material such as a second phase particles can act similar to brittle grains that can affect crack propagation. Fracture or decohesion at the inclusion can either be caused by the external applied stress or by the dislocations generated by the requirement of the inclusion to maintain contiguity with the matrix around it. Similar to grains, the fracture is most likely to occur at the plastic-elastic zone boundary. Then the crack can linkup back to the main crack. If the plastic zone is small or the density of the inclusions is small, the fracture is more likely to directly link up with the main crack tip. If the plastic zone is large, or the density of inclusions is high, additional inclusion fractures may occur within the plastic zone, and linkup occurs by progressing from the crack to the closest fracturing inclusion within the zone.[10]
Fracture toughness testing methods
Fracture toughness is a critical mechanical property for engineering applications. There are several types of test used to measure fracture toughness of materials, which generally utilise a notched specimen in one of various configurations. A widely utilized standardized test method is the Charpy impact test whereby a sample with a V-notch or a U-notch is subjected to impact from behind the notch. Also widely used are crack displacement tests such as three point beam bending tests with thin cracks preset into test specimens before applying load.
Determination of plane strain fracture toughness, KIc
When a material behaves in a linear elastic way prior to failure, such that the plastic zone is small compared to the specimen dimension, a critical value of Mode-I stress intensity factor can be an appropriate fracture parameter. This method provides a quantitative measure of fracture toughness in terms of the critical plane strain stress intensity factor. The test must be validated once complete to ensure the results are meaningful. The specimen size is fixed, and must be large enough to ensure plane strain conditions at the crack tip. This limits the product forms to which the test can be applied.
In the 1960s, it was postulated that small specimens or thin sections fail under plane stress conditions, and that '‘plane strain fracture'’ occurs in thick sections. The ASTM E 399 test method reflects this viewpoint. Over the years, it has been taken as an indisputable fact that toughness decreases with increasing specimen size until a plateau is reached. Specimen size requirements in ASTM E 399 are intended to ensure that KIc measurements correspond to the supposed plane strain plateau. The specimen size requirements in this standard are far more stringent than they need to be to ensure predominately plane strain conditions at the crack tip. The real key to a K-based test method is ensuring that the specimen fractures under nominally linear elastic conditions. That is, the plastic zone must be small compared to the specimen cross section. Consequently, the important specimen dimensions to ensure a valid K test are the crack length a and the ligament length W – a, not the thickness B. Four specimen configurations are permitted by the current version of E 399: the compact, SE(B), arc-shaped, and disk-shaped specimens. Specimens for KIc tests are usually fabricated with the width W equal to twice the thickness B. They are fatigue precracked so that the crack length/width ratio (a /W) lies between 0.45 and 0.55. Thus, the specimen design is such that all of the key dimensions, a, B, and W− a, are approximately equal. This design results in the efficient use of material, since the standard requires that each of these dimensions must be large compared to the plastic zone.
- Plane-strain fracture toughness testing
When performing a fracture toughness test, the most common test specimen configurations are the single edge notch bend (SENB or three-point bend), and the compact tension (CT) specimens. From the above discussion, it is clear that an accurate determination of the plane-strain fracture toughness requires a specimen whose thickness exceeds some critical thickness (B). Testing has shown that plane-strain conditions generally prevail when:
| Where: | B | is the minimum thickness that produces a condition where plastic strain energy at the crack tip in minimal |
| KIC | is the fracture toughness of the material | |
| sy | is the yield stress of material |
When a material of unknown fracture toughness is tested, a specimen of full material section thickness is tested or the specimen is sized based on a prediction of the fracture toughness. If the fracture toughness value resulting from the test does not satisfy the requirement of the above equation, the test must be repeated using a thicker specimen. In addition to this thickness calculation, test specifications have several other requirements that must be met (such as the size of the shear lips) before a test can be said to have resulted in a KIC value.
When a test fails to meet the thickness and other test requirement that are in place to insure plane-strain condition, the fracture toughness values produced is given the designation KC. Sometimes it is not possible to produce a specimen that meets the thickness requirement. For example, when a relatively thin plate product with high toughness is being tested, it might not be possible to produce a thicker specimen with plain-strain conditions at the crack tip.
- Plane-stress and transitional-stress states
For cases where the plastic energy at the crack tip is not negligible, other fracture mechanics parameters, such as the J integral or R-curve, can be used to characterize a material. The toughness data produced by these other tests will be dependent on the thickness of the product tested and will not be a true material property. However, plane-strain conditions do not exist in all structural configurations and using KIC values in the design of relatively thin areas may result in excess conservatism and a weight or cost penalty. In cases where the actual stress state is plane-stress or, more generally, some intermediate- or transitional-stress state, it is more appropriate to use J integral or R-curve data, which account for slow, stable fracture (ductile tearing) rather than rapid (brittle) fracture.
Uses of plane-strain fracture toughness
KIC values are used to determine the critical crack length when a given stress is applied to a component.
| Where: | sc | is the critical applied stress that will cause failure |
| KIC | is the plane-strain fracture toughness | |
| Y | is a constant related to the sample's geometry | |
| a | is the crack length for edge cracks
or one half crack length for internal crack |
Determination of tear resistance (Kahn tear test)
The tear test (e.g. Kahn tear test) provides a semi-quantitative measure of toughness in terms of tear resistance. This type of test requires a smaller specimen, and can therefore be used for a wider range of product forms. The tear test can also be used for very ductile aluminium alloys (e.g. 1100, 3003), where linear elastic fracture mechanics do not apply (see properties in practice).
Fracture toughness of AISI steel
The fracture toughness of AISI 4340 steel has been determined by several methods, i.e. (i)Jr curve, (ii)δr curve, (iii) Kr curve, (iv) stretch zone size measurements (v) non-linear energy method of Poulose et al. and by (vi) a new procedure proposed recently by Banerjee. Compact tension specimens with TL orientation have been used. All the specimens used satisfied the ASTM E813 test size requirements. Applicability of various fracture toughness estimation procedures like (i) Hanhn and Rosenfield, (ii) Rolfe and Barsom and (iii) equivalent energy rate method of Bucci et al. have been examined. These values have been compared with true fracture toughness of the material obtained by ASTM E399 test procedure.[11]
Comparison of various conventional test methods indicate multiple specimen curve method gives most consistent results and these values are within +15% of the true fracture toughness value. Out of all estimation procedures Rolfe and Barsom's method appears to be best, giving number within +8% of the true fracture toughness value. Non-linear energy method was found to give a fracture toughness value consistent with true fracture toughness of the material
Other methods for determining fracture toughness
- ASTM C1161 Test Method for Flexural Strength of Advanced Ceramics at Ambient Temperature
- ASTM C1322 Practice for Fractography and Characterization of Fracture Origins in Advanced Ceramics
- ASTM E4 Practices for Force Verification of Testing Machines
- ASTM E112 Test Methods for Determining Average Grain Size
- ASTM E177 Practice for Use of the Terms Precision and Bias in ASTM Test Methods
- ASTM E337 Test Method for Measuring Humidity with a Psychrometer (the Measurement of Wet- and Dry-Bulb Temperatures)
- ASTM E399 Test Method for Plain-strain Fracture Toughness of Metallic Materials
- ASTM E691 Practice for Conducting an Interlaboratory Study to Determine the Precision of a Test Method
- ASTM E740 Practice for Fracture Testing with Surface-Crack Tension Specimens
- ASTM E1823 Terminology Relating to Fatigue and Fracture Testing
- IEEE/ASTM SI 10 Standard for Use of the International System of Units (SI) (The Modern Metric System)[12]
- ISO 28079:2009, the Palmqvist method, used to determine the fracture toughness for cemented carbides.[13]
Strain energy release rate
For two-dimensional problems (plane stress, plane strain, antiplane shear) involving cracks that move in a straight path, the mode I stress intensity factor is related to the energy release rate, also in mode I, by


where is the Young's modulus and for plane stress and for plane strain.[14]


See also
References
- ↑ Hertzberg, Richard W. (December 1995). Deformation and Fracture Mechanics of Engineering Materials (4th ed.). Wiley. ISBN 0-471-01214-9.
- ↑ Sérgio Francisco dos Santos; José de Anchieta Rodrigues (2003). "Correlation Between Fracture Toughness, Work of Fracture and Fractal Dimensions of Alumina-Mullite-Zirconia Composites". Materials Research. 6 (2): 219–226. doi:10.1590/s1516-14392003000200017.
- ↑ Courtney, Thomas (2005). Mechanical Behavior of Materials. Chapter 9: Waveland Press. pp. 433–436. ISBN 1-57766-425-6.
- ↑ Titanium Alloys - Ti6Al4V Grade 5, AZO Materials, 2000, retrieved 24 September 2014
- ↑ AR Boccaccini; S Atiq; DN Boccaccini; I Dlouhy; C Kaya (2005). "Fracture behaviour of mullite fibre reinforced-mullite matrix composites under quasi-static and ballistic impact loading". Composites Science and Technology. 65: 325–333. doi:10.1016/j.compscitech.2004.08.002.
- ↑ J. Phalippou; T. Woignier; R. Rogier (1989). "Fracture toughness of silica aerogels". Journal de Physique Colloques. 50: C4–191. doi:10.1051/jphyscol:1989431.
- ↑ Wei, Robert (2010), Fracture Mechanics: Integration of Mechanics, Materials Science and Chemistry, Cambridge University Press, retrieved 24 September 2014
- ↑ Liang, Yiling (2010), The toughening mechanism in hybrid epoxy-silica-rubber nanocomposites, Lehigh University, p. 20, retrieved 24 September 2014
- ↑ Padture, Nitin (12 April 2002). "Thermal Barrier Coatings for Gas-Turbine Engine Applications". Science. 296: 280–284. Bibcode:2002Sci...296..280P. doi:10.1126/science.1068609.
- 1 2 3 4 5 Courtney, Thomas H. (2000). Mechanical behavior of materials. McGraw Hill. ISBN 9781577664253. OCLC 41932585.
- ↑ Engineering Fracture Mechanics, Volume 25, Issue 4, 1986
- ↑ NIST SRM 2100 Fracture Toughness of Ceramics
- ↑ ISO 28079:2009, Palmqvist toughness test, Retrieved 22 January 2016
- ↑ Liu, M.; et al. (2015). "An improved semi-analytical solution for stress at round-tip notches" (PDF). Engineering Fracture Mechanics. 149: 134–143.
Other references
- Anderson, T L., Fracture Mechanics: Fundamentals and Applications (CRC Press, Boston 1995).
- Davidge, R. W., Mechanical Behavior of Ceramics (Cambridge University Press 1979).
- Lawn, B., Fracture of Brittle Solids (Cambridge University Press 1993, 2nd edition).
- Knott, Fundamentals of Fracture Mechanics (1973).
- Foroulis (ed.), Environmentally-Sensitive Fracture of Engineering Materials (1979).
- Suresh, S., Fatigue of Materials (Cambridge University Press 1998, 2nd edition).
- West, J.M., Basic Corrosion & Oxidation (Horwood 1986, 2nd edn), chap.12.
- Green, D.J.; Hannink, R.; Swain, M. V. (1989). Transformation Toughening of Ceramics, Boca Raton: CRC Press. ISBN 0-8493-6594-5.
- https://web.archive.org/web/20050516013555/http://www.sv.vt.edu/classes/MSE2094_NoteBook/97ClassProj/exper/gordon/www/fractough.html
- http://www.springerlink.com/content/v2m7u4qm53172069/fulltext.pdf sriram