Flow map
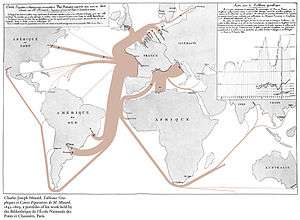
Charles Joseph Minard’s map of French wine exports for 1864.
Flow maps in cartography are a mix of maps and flow charts, that "show the movement of objects from one location to another, such as the number of people in a migration, the amount of goods being traded, or the number of packets in a network".[1]
Overview
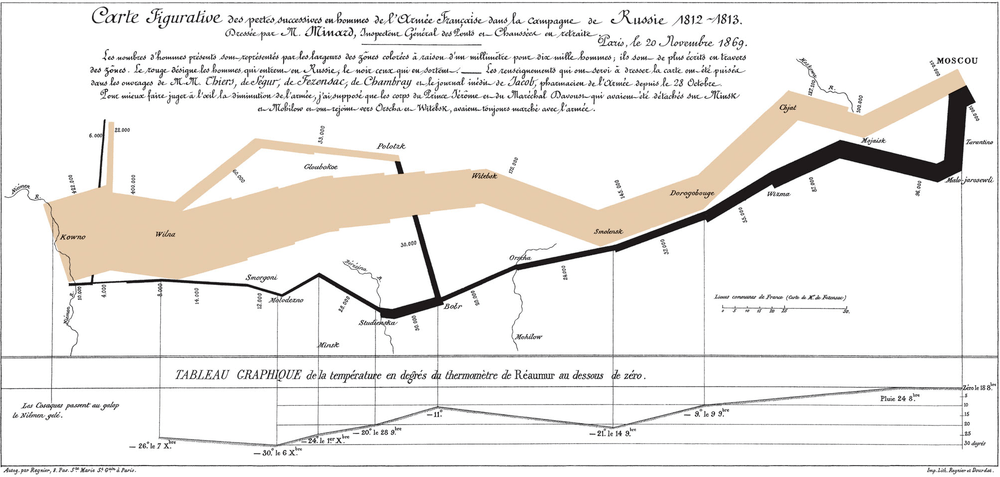
Minard's map of Napoleon's disastrous Russian campaign of 1812.
Flow maps can be used to show movement of almost anything, such as:[2]
- What it is that flows, moves, migrates, etc.
- What direction the flow is moving and/or what the source and destination are.
- How much is flowing, being transferred, transported, etc.
- General information about what is flowing and how it is flowing.
In contrast to route maps, flow maps show little aside from the paths from one point to another.[2]
Other types of flow maps
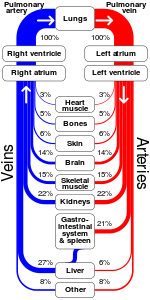
A non-cartographic flow map showing the relative percentages of cardiac output delivered to major organ systems
Beside the flow maps in cartography there are several other kind of flow maps:
- Baker flow map of fluid flows
- Blood flow maps, see history of neuroimaging
- Flow map or solution operator, see random dynamical system
- Process flow map of a manufacturing process
- Sankey diagram in petroleum engineering
- Traffic Flow Maps
- XSL flow maps, see XSL Formatting Objects
See also
- Flow diagram (disambiguation)
- Thematic map
References
- ↑ Phan, Doantam; Xiao, Ling; Yeh, Ron; Hanrahan, Pat; Winograd, Terry (2005). "Flow Map Layout". Proceedings of the 2005 IEEE Symposium on Information Visualization (InfoVis '05): 219–224. doi:10.1109/INFVIS.2005.1532150.
- 1 2 Harris, Robert L. (1999). Information Graphics. p. 157.
Further reading
- Dent, Borden D. (1999). Cartography: Thematic Map Design. New York: McGraw-Hill. ISBN 0-697-38495-0.
- MacEachren, Alan (1995). How Maps Work: Representation, Visualization, and Design. New York: Guilford Press. ISBN 1-57230-040-X.
- Harris, Robert L. (1999). Information Graphics. Oxford University Press. ISBN 0-19-513532-6.
External links
| Wikimedia Commons has media related to Flow maps. |
This article is issued from
Wikipedia.
The text is licensed under Creative Commons - Attribution - Sharealike.
Additional terms may apply for the media files.